Cable inspections the uncrewed way
Creating a 3D dataset from a USV and UAV survey
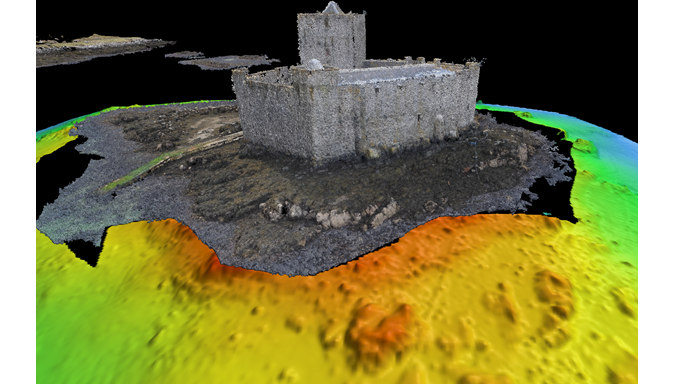
XOCEAN has completed 35 cable inspection surveys using a combination of uncrewed surface vessels (USVs) and uncrewed aerial vehicles (UAVs) between the Scottish mainland and Western Isles. There was a large geographical spread to the project, with operations taking place between 55°N and 58°N and on 25 different islands. Flying the UAVs at low water and sailing the USVs at high water produced a seamless land/sea 3D data set at the highest resolution possible. The project was completed within a six-week time frame.
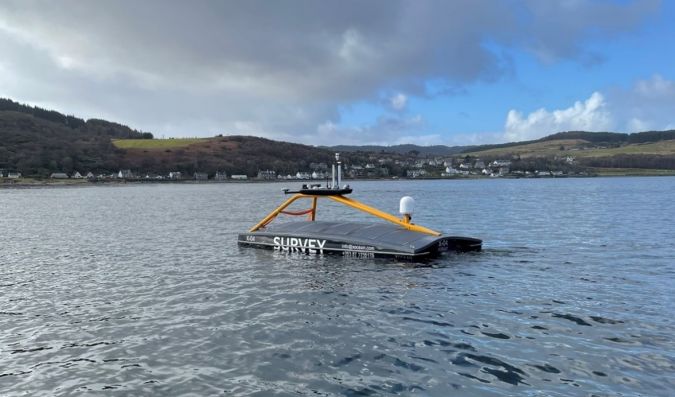
Two USVs were used to complete the survey campaign: X-04, an XO-450 class USV, and USV Harry. X-04 is a 4.5m catamaran vessel powered by a 5MaH battery that is kept topped up by a small diesel generator that uses only 9 litres of diesel per day. USV Harry is a 2.5m USV that is powered by a total of 3MaH batteries only. X-04 was used to survey the more exposed and longer cables, while USV Harry surveyed the very shallow and the easier-to-access cables.
X-04 was equipped with a new Norbit Winghead i77h 0.5-degree multibeam echosounder complete with an Applanix POS MV IMU. USV Harry was equipped with an R2Sonic 2020 multibeam echosounder and again with an Applanix POS MV IMU. Valeport Swifts were used on both USV winches for sound velocity casts. Both USVs used QPS QINSy to acquire the data and to provide information to the USVs’ autopilot to steer them along the survey lines. Bathymetry, backscatter and sidescan were acquired from each multibeam system.
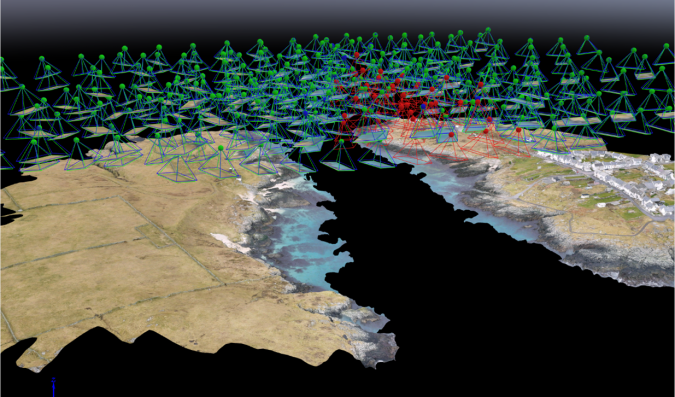
Two senseFly eBee X UAVs, one equipped with a S.O.D.A 3D camera and one with an AeriaX camera, were used to acquire the topographic data. Bathymetry was also extracted from the UAV data set in the very shallow water, using the QPS Qimera SfM refraction algorithm to enable it to match the USV bathymetry. Both cameras are designed purely for UAV use and have 20 MPs and 24 MPs respectively. The data sets from the UAVs use PPK positioned imagery, which is then processed using Pix4D Mapper.
Methodology
The USVs were transported by trailer, which meant that it was very quick to move from island to island and, most importantly, that they weren’t affected by weather in the way that a traditional survey vessel would be. This was also achieved using very little fuel (just 4x4 vehicles). The USVs could be deployed on cables that were sheltered, which meant that the project was affected by very little weather downtime, especially given that it was performed in winter.
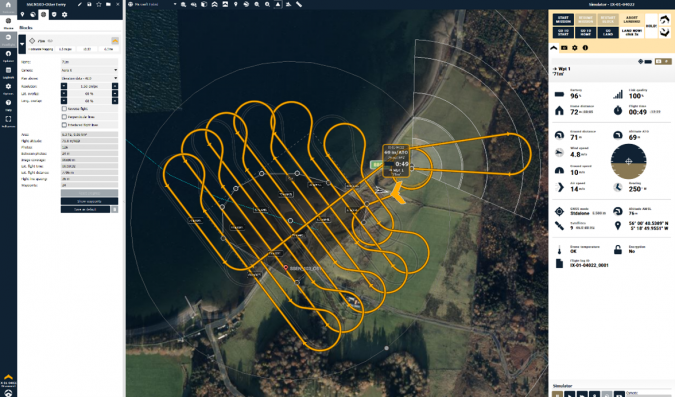
If time and conditions allowed, the UAV was flown before the USV sailed. The UAV data was then rapidly processed to produce an orthophoto and LAS files to show the extent of the UAV data coverage but also, and more importantly, to show where the dangerously shallow areas were for the USV to avoid during its survey. The UAV was flown at two altitudes in one flight: 119m and 75m. The two imagery data sets were combined to give the highest possible resolution, with the higher flight used to provide longitudinal overlap to ensure enough key point matches could be identified by the software. The eBee X UAV with the new endurance batteries allowed the UAV to fly for approximately 1 hr 15 mins in good conditions and 40 mins in 12m/s wind speed (the maximum in which it can fly). If in mobile phone range, RTK corrections were streamed to the UAV in real time. This allowed for accurate rapid processing but also seemed to allow the eBee X to land much more easily, especially on undulating terrain or if landing from offshore onto land over a cliff.
Once the UAV data had been collected, it was put through a three-stage post-processing workflow.
- The raw GNSS and IMU data was post-processed in senseFly’s eMotion software package.
- The geo-tagged imagery was loaded into a new Pix4D project.
- The LAS files were loaded into QPS Qimera for seamless matching with the USV multibeam data.
If the cable was buried on land, a radio detection unit was used to ascertain where the cable was and how deep it was buried. Many of the power cables were laid over 30 years ago, so the as-given location was often incorrect. Using this information and the UAV data, the surveyors had a better idea of where the cable was underwater.
The USVs were operated with depth stop alarms enabled, which means that if the depth becomes too shallow, the USV will stop, reverse back to a safe depth, and wait for the onshore USV pilot to instruct it on what to do next. This feature was not actioned during the survey as the shallowest sections were run parallel to shore and always within the previous swath coverage, which ensured the safest operations as well as very high-quality data. The USV pilots also had access to real-time 360-degree vision from the cameras on the USVs, and AIS was integrated into each USV’s QINSy Navigation Display and the XO-450 Cyberdeck.
The cable RPL was used as the initial survey line for the USV to follow. This also output a bearing and cross course to the USV’s autopilot. The USV pilot adjusted the speed of the USV and kept a lookout while the USV was guided by the survey computer along the line. After completing the RPL and at least two wing lines, the USV ran parallel lines to the shore. When running parallel lines, the QPS QINSy AutoSwath function drew a line based on the previous multibeam swath extents using a 110% overlap to ensure that the USV was always over previously surveyed data. The online surveyor monitored all the time and the real-time DTM colour map was coloured in such a way that when it reached a particular value it turned blue. The blue colour was essentially a safety contour for the USV, enabling safe but efficient data collection.
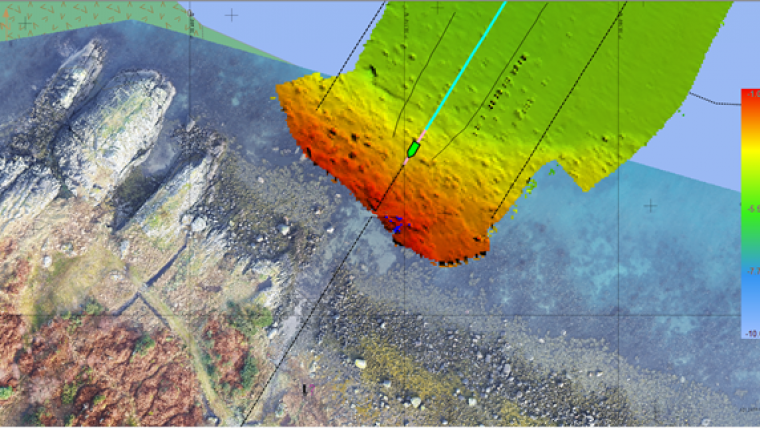
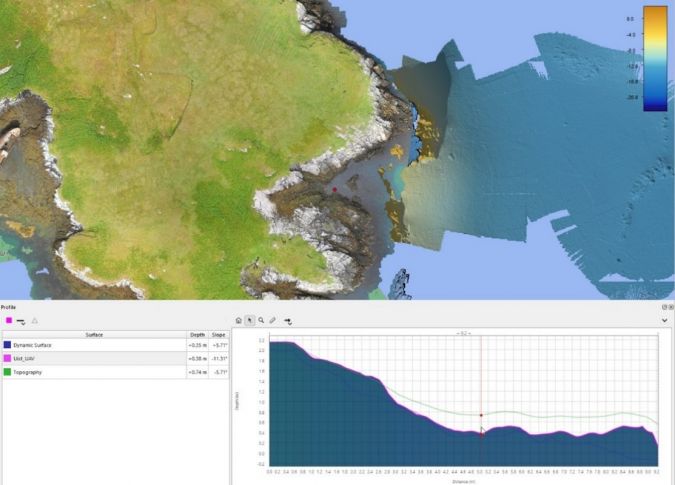
Dynamic DTM surface
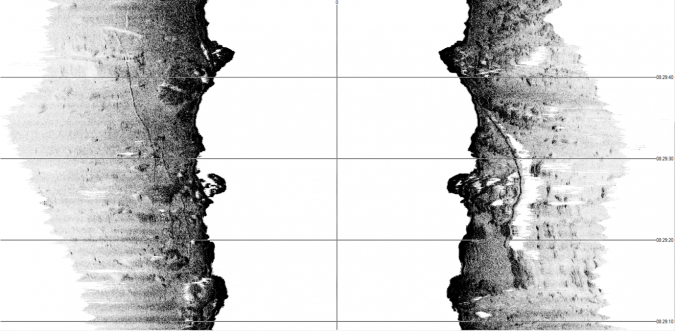
Looking just at the bathymetry, detection of the cable in real time was challenging as the terrain was inherently rocky and there was also a great deal of kelp (sea grass) in the shallower areas. However, using the sidescan output from both the Norbit and R2Sonic multibeam systems proved to be very effective and, where the cable was found to be a long way from the as-given location, the USV was piloted along the cable by looking at the sidescan display.
The multibeam data from the USVs was brought into the same QPS Qimera project and processed independently. Sound velocity data was loaded into the acquisition software.
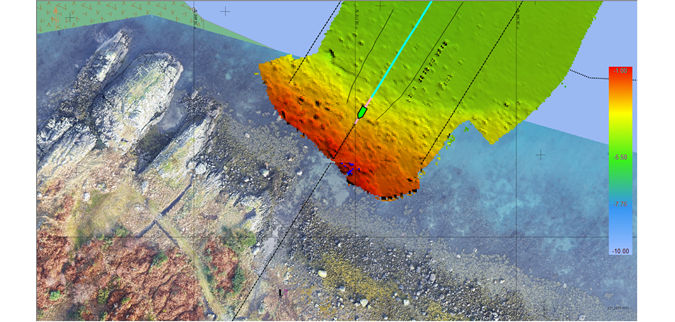
A dynamic DTM surface was created using both the cleaned multibeam data and the UAV files. During data cleaning, it was possible to view the two data sets together either coloured by file or, preferably, coloured by RGB. This gave a photorealistic point cloud of the UAV data with the USV multibeam data coloured white, making it easy to see what was rock and what was noise in these splash zone areas.
From the final cleaned data, the as-found cable was digitized, and any boulders or seabed features close to or on the cable were found and reported. A full report was written for each cable, complete with GIS, charts and final RPL and event listings.
Conclusions
Conducting this survey campaign with USVs and UAVs not only enabled the collection of the highest possible resolution data, but ensured that the survey was safe, carbon-neutral and logistically efficient. The 70 UAV flights and 35 USV surveys were an exceptional achievement in the six-week time frame and proved how well suited to this type of survey XOCEAN’s uncrewed technology is. It also proved that, in shallow water, the sidescan output from the multibeam systems is as good as a hull-mounted traditional sidescan, without the inconvenience and safety issues of running a towed sidescan in these water depths, currents and kelp.

Value staying current with hydrography?
Stay on the map with our expertly curated newsletters.
We provide educational insights, industry updates, and inspiring stories from the world of hydrography to help you learn, grow, and navigate your field with confidence. Don't miss out - subscribe today and ensure you're always informed, educated, and inspired by the latest in hydrographic technology and research.
Choose your newsletter(s)


