
Machine learning as a tool
Detecting boulders in a multibeam point cloud
Machine learning is currently experiencing a surge of interest. Of course, what first come to mind are self-driving cars, face recognition and internet algorithms. However, while these are great examples of machine learning in action, artificial intelligence can also be applied for hydrographic purposes. A Bachelor’s research project was carried out at QPS B.V. into the detection of boulders in multibeam point cloud data using machine learning.
The objective of the research was to develop a working tool that uses machine learning to detect boulders or rocks in multibeam point cloud data. The approach differs from the tools that processors are currently familiar with, such as filter tools that the user can employ to locate boulders. While there is nothing wrong with the current tools, machine learning aims to automate the entire process, mimicking the steps that a human processor would take to detect objects.
Requirements of machine learning
Machine learning requires input data, and lots of it. In fact, the more data, the better. An integral part of any machine learning is the training of the model using real world sample data. Rather than creating fixed algorithms, machine learning adapts the criteria of what is a boulder or rock while learning. The training data needs to be checked and prepared ahead of time by a professional. In this case, a good example of this preparation might be to start with available multibeam point cloud data containing certain objects of interest. These objects would be selected within the data, adding a class to each data point (boulder or seafloor). The more thoroughly the data is prepared, the better the algorithm functions. Due to the nature of machine learning, the aim of this algorithm is to mimic the input data, thus indirectly learning from processors who prepare the input data. This means that the aim is to achieve the level of accuracy that a human processor produces.
When properly prepared, the machine learning algorithm can produce locations of objects almost as accurately as professional processors are able to do. With more input data and classification of that data by different professionals, the algorithm gains more insight into the output that it is expected to achieve. Following this cycle, the algorithm can potentially perform better than a single human processor, as it combines the knowledge of various processors and situations. On the other hand, the algorithm will never be able to cope with a situation that is completely unlike one that it has encountered before.

Creating the tool
The process of creating the tool was undertaken in a simple Jupyter environment, as the tool was developed in Python 3.8. Creating a machine learning algorithm from scratch is time-consuming, so for this research a library, or a preprogrammed set of usable code, was used. In this case, the library Open3D was used. This allowed the research to follow the basic principles that have been precoded by professional machine learning experts.
The result is a working prototype that is able to import data, run the detection algorithm, and export its predictions on object locations. Training of the algorithm was done using a different set of objects for which boulders needed to be predicted (these pretrained models can be saved for later use). The training process is very computer resource heavy, and this research was executed on a Nvidia GTX 1070, which proved to be a bottleneck. The training process depends heavily on the hardware and the amount of input data, and in this case it took at least 1 hour for 10 million points. With the current setup, the predicted boulders were found while classifying 300,000 data points per 10 minutes. To compare, a modern multibeam produces between 10,000 and 40,000 points per second.
Qualitative results
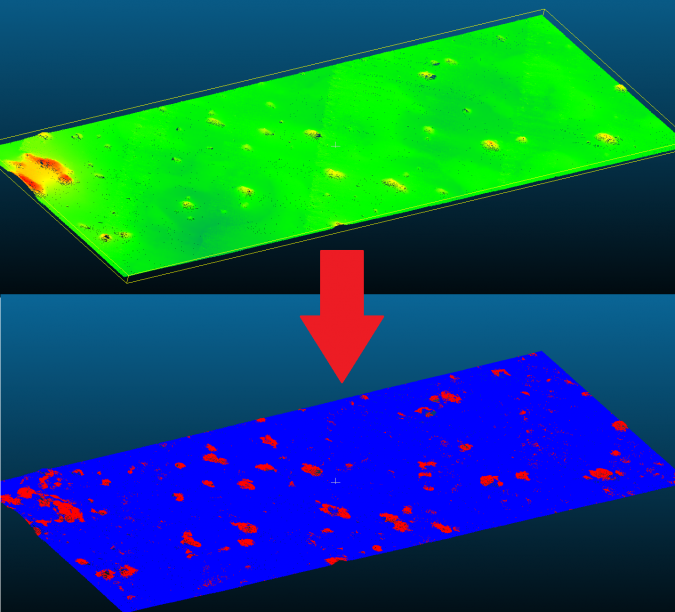
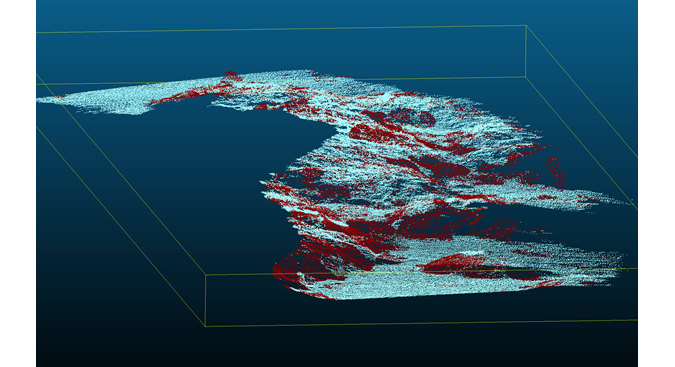
The algorithm was trained to produce a list of boulders from the supplied and prepared data. Qualitative results indicated that the algorithm was differentiating between the boulders according to the preprocessed data used to train it.
This conclusion is based on the processing of a small area by several processors, trying to reach the ground truth as much as possible. The actual analysis was therefore based on an assumed ground truth: the accuracy of human processors. It therefore represents the ability of the algorithm to match the accuracy of manually processed data and picked boulder locations.
Several issues remained after visual analysis of the results, mainly concerning the shape of the detected boulders. The algorithm did not completely fill in the boulder locations with the classification ‘boulder’, and had issues with boulders that it was not familiar with, as expected. This led to the conclusion that more training and more or better data would be required.
Another conclusion related to the size of the found objects. As part of the algorithm, the software smartly scales the boulders to new situations. As a result, the software started to find tiny boulders that, based on their size, should not be classified as such, but as pebbles. A future adaptation to the algorithm could allow for a traditional bandwidth filter that discards objects below a certain threshold.
Quantitative results
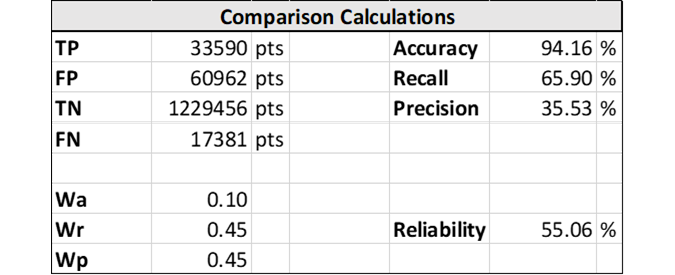
To verify the quantitative results of the tool, a comparison was made between the results of the tool and those of ten different data processors. For this, seven MIWB students and three QPS data processors were asked to classify boulders in the same dataset using the QPS Qimera Geopicking tool. This resulted in a series of objects in which differences could be seen between manual processors. No further analysis was done on why different processors picked different sets of boulders, but the commonly picked boulders were used as ground truth for the algorithm validation. The resulting list of manually picked boulders was then compared with the output of the tool to gauge its accuracy.
A statistical analysis of the comparison yielded an overall reliability value of 55%, which means that the results of the tool had a 55% similarity to the manually processed dataset. This is built up from three metrics: accuracy, precision and recall. Accuracy indicates the percentage of correct predictions, while precision indicates how many of the positive predictions were actually correct. Recall indicates how many of the actual positive values were also predicted as positive. The three parameters each have a weight in the final reliability (Wa, Wr and Wp). As can be seen in the table, accuracy is comparatively higher than precision and recall, the reason being a class imbalance between seafloor (many) and boulder points (few), thus misrepresenting the total reliability.
This means that the algorithm is not yet ready to be trusted. The accuracy consists of both ‘false positives’, boulders detected by the algorithm but not by the human operator, and ‘false negatives’, boulders detected by the human operator but not by the algorithm. The number of false positives, or locations where the algorithm thinks a boulder is present where in reality it is not, and false negatives, where the algorithm missed out an existing boulder, represents the error of the algorithm, at first glance already too great to be trustworthy as of now.
Although the algorithm in its current state is far from correct, it might still be of help to the surveyor as a tool that can roughly detect objects. It also became clear that future standards for input training data preparation must be set, which would further increase the reliability of the algorithm. Of interest, but not further studied, is the question why different processors indicate sometimes very different locations as boulders. Using this as further input would allow the algorithm to take these situations into account as well.
Machine learning in hydrography
Although the results of this research are not as reliable as was hoped, this tool in specific, and machine learning in general, can be of great help once made more reliable. Even the rough prototype created during this research could help the processor to save time by detecting the obvious boulders and smaller, harder to notice objects. Ideally, results will be obtained at just the press of a button, resulting in less manpower required in the processing department, less time to process and, more importantly, more reliable results. Perhaps even more important is that it could also lead to more consistent results across processing datasets as the algorithm provides the same output every time.
The second use for this kind of algorithm is the live detection of boulders. In the case of automated cars, it is possible to display objects that have been detected live to the autonomous system. This can also be achieved for surveying vessels. As the vessel moves and the surveying systems are running, machine learning algorithms can show dangerous or interesting locations to the crew. This could increase safety and awareness of the surroundings. However, the processing time needs to be reduced, as more data is currently accumulated than can be processed in the same time.
Object detection algorithms already exist, and work by trying to figure out a common property of a certain object. Machine learning could add flexibility, human-like processes and applicability. Machine learning cannot only detect objects, but can also predict locations based on its previous experience, in the same way that a processor finds these locations. It can also use any data property to its advantage, as it can use shape, size and other properties that objects share. This forms a reliable algorithm which can, more than existing filters, present the client with a complete picture. A machine learning algorithm can be trained to detect anything that is deemed important. The training cannot however be done in the field yet, and will therefore require specific adaptations to the software package.
Conclusion
Machine learning seems to have a lot of potential, as it aims to further automate the process of object detection and even show it live as feedback. Applying it to survey routines may yield great improvements in data processing, as well as having other advantages. Before getting to that stage, however, more research is required. The currently presented research forms a small step in this direction.
Further reading
- Open3D: http://www.open3d.org
- Accuracy, recall and precision: https://www.analyticsvidhya.com/blog/2020/11/a-tour-of-evaluation-metrics-for-machine-learning/

Value staying current with hydrography?
Stay on the map with our expertly curated newsletters.
We provide educational insights, industry updates, and inspiring stories from the world of hydrography to help you learn, grow, and navigate your field with confidence. Don't miss out - subscribe today and ensure you're always informed, educated, and inspired by the latest in hydrographic technology and research.
Choose your newsletter(s)


