Mapping northern Greenland waters
A blank spot on nautical charts in ice-infested waters
An understanding of the interplay between glaciers and the ocean is needed to improve sea-level rise projections. Seafloor mapping is critical in this pursuit, particularly where the ice sheets of Greenland and Antarctica meet the ocean. Northern Greenland’s marine realm remains one of Earth’s least explored areas, with completely uncharted fjords. In 2019, one of these fjords was mapped by the Swedish icebreaker Oden, with the next unmapped fjord to the east the target for 2024.
How marine-terminating glaciers impact global sea-level rise
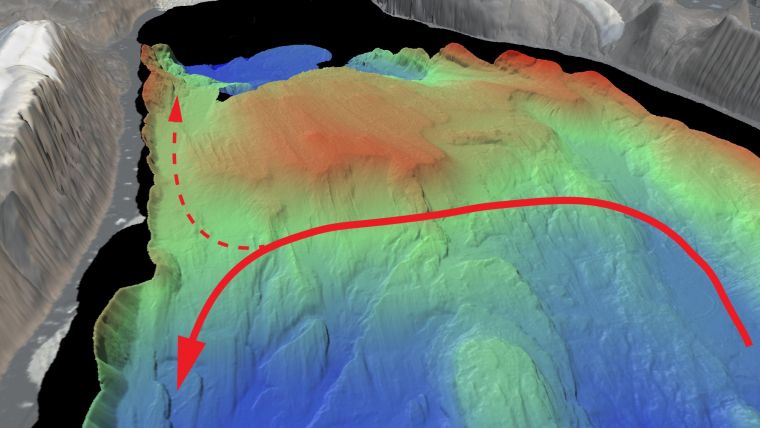
The large ice sheets on Greenland and Antarctica consist of merged glaciers that drain areas of the ice sheets into the ocean through ice streams, similar to how rivers drain confined regions on land (Figure 1). These glaciers play a crucial role in maintaining the ice sheets’ mass balance over time. The annual ice accumulation primarily occurs through precipitation within the ice sheets’ interiors, while mass loss results from melting and calving. Calving is the process whereby ice chunks break off from the glaciers’ fronts, forming icebergs that eventually melt and mix with the ocean, causing sea-level rise. In recent decades, the stability of glaciers that drain into the ocean, known as ‘marine outlet glaciers’, has become a concern due to their alarming acceleration in mass loss. These marine outlet glaciers are highly dynamic and can respond rapidly to environmental changes such as warming oceans, which can cause submarine ice-melting. Their dynamics are also heavily influenced by the characteristics of the substrate they rest on and the shape and depth of the seafloor at their grounded margins or nearby.
The observed average global mean sea-level rise was about 1.6mm/year between 1900 and 2018, but accelerated in the 1990s to about 3.4mm/year between 1993 and 20181. The single largest contributor to this rise in recent decades has been the melting of the Greenland Ice Sheet, accounting for nearly 0.5mm/year2. The Greenland Ice Sheet has a total volume equivalent to about 7.4 metres of global mean sea level, but few if any scientists believe that this immense ice mass will completely disappear over hundreds of years, even under the worst global warming scenarios. However, there are concerns that this could happen within the next 1,000 years3. Nevertheless, a sea-level rise of just one metre, which some projections approach by the end of this century4, would impact millions of people globally. It is therefore crucial that we understand the rate at which the Greenland and Antarctic Ice Sheets can lose mass and contribute to global mean sea-level rise. This challenging task was emphasized in the IPCC’s special report on the ocean, cryosphere and sea-level change, which highlighted the urgent need to understand these processes and find viable solutions.
The importance of seafloor mapping
To improve future global mean sea-level rise projections, the complex ice-ocean interactions must be understood and their geographical locations identified. This requires both seafloor mapping and collection of oceanographic measurements in some of the world’s most remote areas: the polar regions. Seafloor mapping is essential as it helps determine the bathymetry, which plays a crucial role in identifying areas where warmer ocean water can reach marine outlet glaciers or flow beneath their floating extensions, known as ice shelves or ice tongues when confined within fjords, and contribute to melting.
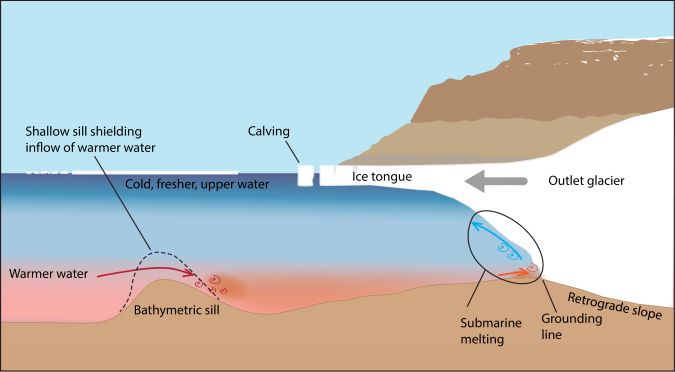
Fjords are commonly overdeepened after having served as pathways for outlet glaciers during several glaciations. The seafloors of these fjords are filled with traces from the past glaciers in the form of submarine glacial landforms. Some of the fjords have prominent shallow sills that can act as thresholds at their entrances. These sills are often comprised of glacially eroded material covering a resistant rock formation. They may be shallow enough to prevent inflow of warmer subsurface waters reaching the outlet glaciers’ margins (which promotes melting), while other sills are small or contain deeper channels that let the warmer water pass (Figure 2). In northern Greenland, warmer subsurface water of Atlantic origin has been observed in several fjords. This water has, after entering Fram Strait between Svalbard and Greenland or across the Barents Sea, circulated all the way around the Arctic Ocean before reaching the northern Greenland glaciers. The water is only slightly warmer than 0°C when reaching the glaciers, but this is enough to cause substantial melting. It flows below fresher and very cold water (less than -1°C), typically representing meltwater. The warmer saltier water is heavier and therefore flows at depths where the seafloor morphology will greatly influence its path.
Mapping Petermann Fjord in northern Greenland
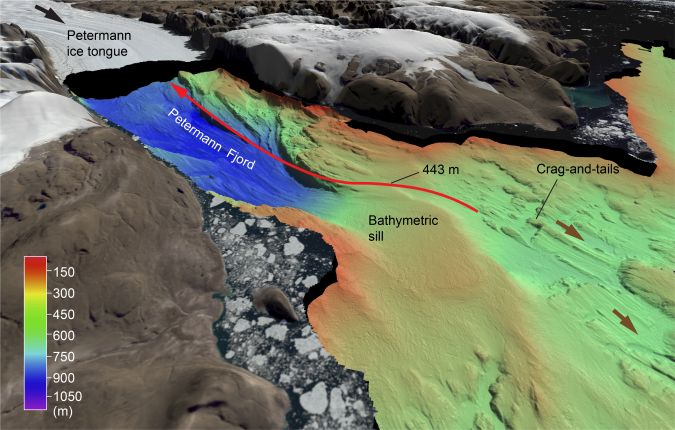
The Petermann 2015 expedition with the Swedish icebreaker Oden mapped the entire Petermann Fjord, into which Petermann Glacier drains, and the adjacent section of Nares Strait in northern Greenland (Figure 3). This glacier received a lot of international attention when it lost approximately 40% of its floating ice tongue during two major calving events in 2010 and 2012. The largest event occurred in 2010 when the calved tabular iceberg was about 251km2 in size, which is slightly larger than the area of Amsterdam. Oceanographers subsequently discovered that warmer water of Atlantic origin enters the fjord5.
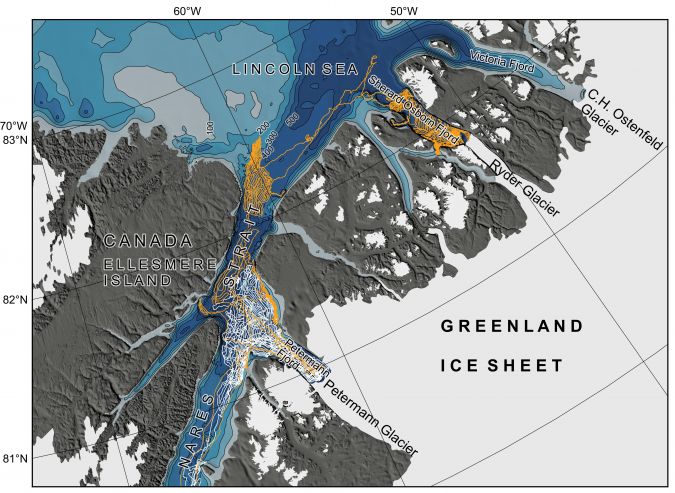
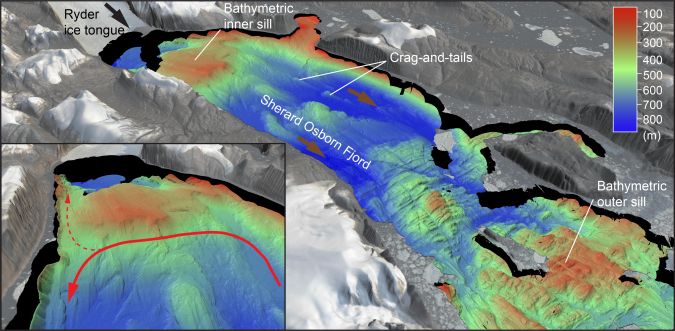
Multibeam mapping in 2015 revealed the presence of a well-developed sill at the fjord entrance, although of insufficient size to prevent the warmer water from reaching the glacier (Figure 4)6. In contrast to Petermann Glacier, Ryder Glacier, which drains into Sherard Osborn Fjord further to the north-east, had been stable for decades. Sherard Osborn Fjord had never been explored by a surface vessel and there were no soundings available to suggest what the seafloor might look like. The reason for this is the sea-ice conditions in the Lincoln Sea, which are the most severe in the Arctic Ocean. The bathymetry in the southern Lincoln Sea is based on a very sparse grid of spot soundings acquired by the Canadian Hydrographic Service. Consequently, it was decided to prioritize the mapping and investigation of Sherard Osborn Fjord for the next expedition with icebreaker Oden: the Ryder 2019 expedition.
The uncharted Sherard Osborn Fjord
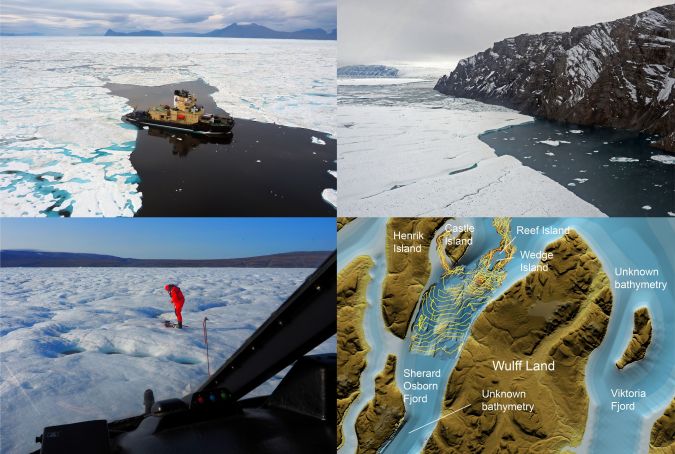
The northern end of Nares Strait was reached without too many difficulties in 2019, thanks to the strong icebreaker Oden and the relatively light sea ice in the strait that year. However, Oden hit a wall of hard multiyear sea ice more than four metres thick as it entered the Lincoln Sea. The transit of approximately 46 nautical miles diagonally across the southern Lincoln Sea to Sherard Osborn Fjord therefore had to be planned using numerous ice-reconnaissance flights with the helicopters carried onboard. The purpose was to locate fracture systems in the sea ice that facilitated icebreaking.
After completing this crossing in approximately 1.5 days, the next challenge awaited – huge tabular icebergs in Sherard Osborn Fjord (Figure 5). These icebergs had remained trapped in the fjord since previous calving events because the sea ice in the Lincoln Sea prevents them from escaping, in contrast to Petermann Fjord where the icebergs are expelled into Nares Strait, where they begin their journey southward and eventually disintegrate and melt. During the initial helicopter reconnaissance of Sherard Osborn Fjord, the entire entrance was blocked by tabular icebergs, except for a narrow passage along the shore of Castle Island (Figure 5). However, entering the fjord through such a small passage into uncharted waters was deemed unsafe. Understanding the movement of the icebergs within the fjord was essential – was there a risk of becoming trapped inside? In addition to analyses of satellite imagery, GPS transponders were placed on a couple of selected icebergs to track them in real time (Figure 5).
It was discovered that the icebergs circulated more or less regularly in an anticlockwise direction within the fjord, indicating that, with careful monitoring, there would always be a navigable path through them to exit the fjord. Another major challenge was the fact that the fjord was completely uncharted. Two small islands, Reef and Wedge islands, indicated that it was not possible to just steam into the fjord and expect it to be deep everywhere. Instead, the installed Kongsberg EM122 (1°×1°, 12kHz) multibeam had to be used to its full extent. Systematically mapping back and forth across the fjord, with the beams extending into the uncharted fjord during each pass, enabled safe navigation. While this mode of operation was time consuming, it had the advantage of providing high-quality bathymetry. Mapping was done in this way during the nights, while sediment coring and other sampling operations filled the days. Two weeks were spent mapping and sampling in Sherard Osborn Fjord and the entire fjord was covered, apart from some small holes where icebergs were constantly in the way.
The bathymetry of Sherard Osborn Fjord is notably complex with two major sills: one at the fjord entrance and another just in front of the current position of the ice-tongue margin (Figure 6). Oceanographic measurements revealed that while the outer sill would allow the passage of warmer water into the fjord, the inner sill is shallow enough to shield Ryder Glacier from most of the inflowing warmer water. The inner sill in Sherard Osborn Fjord is believed to be a crucial factor in explaining the contrasting behaviour of Ryder and Petermann glaciers over the past few decades9. It underscores the importance of incorporating seafloor bathymetry into numerical models used to accurately project the contribution of glaciers to future sea-level rise.
The North of Greenland 2024 expedition
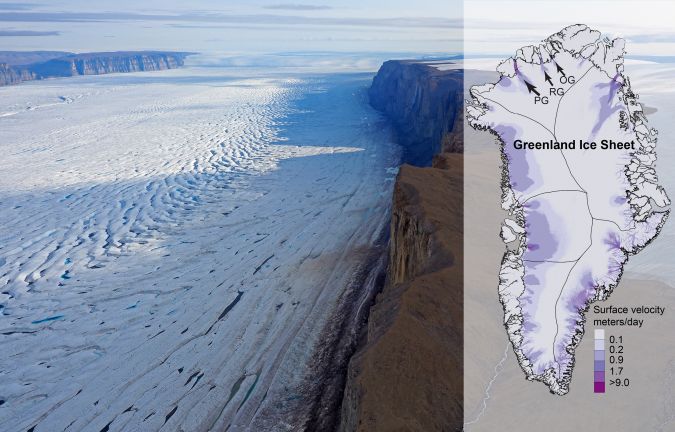
C.H. Ostenfeld Glacier, which drains into Victoria Fjord, lies to the east of Ryder Glacier. Currently, Victoria Fjord remains completely unmapped, with no ship having entered it (Figure 3). C.H. Ostenfeld Glacier recently lost nearly all its floating ice tongue and will be the primary focus of the North of Greenland 2024 expedition, which is part of the North Greenland Earth-Ocean-Ecosystem Observatory (GEOEO) research theme. The Swedish Polar Research Secretariat adopted this theme following a proposal submitted to its Polar Research Process. The expedition builds on the achievements of the Petermann 2015 and Ryder 2019 expeditions and will again utilize the Swedish icebreaker Oden.
The overarching goal of GEOEO is to improve our understanding of North Greenland’s marine cryosphere’s dynamic history and response to climate change. This includes investigating the implications for marine and terrestrial ecosystems in North Greenland, the adjacent Arctic Ocean, and the contribution of the North Greenland Ice Sheet to future sea-level rise. If the expedition successfully maps Victoria Fjord, it will complete the mapping of all three major outlet glaciers north of 80° that drain the northern sector of the Greenland Ice Sheet.
The bathymetric data collected will be contributed to both IBCAO and BedMachine through the Nippon Foundation - GEBCO Seabed 2030 project. This global initiative, launched in 2017, aims to comprehensively map the world’s entire ocean floor by 2030. While the southern Fram Strait is one of the better-mapped regions in the world’s oceans, the Lincoln Sea and areas in the central Arctic Ocean, north of Greenland and north of the eastern part of the Canadian Arctic Archipelago remain among the least mapped regions. Looking at the entire world’s oceans, the Nippon Foundation-GEBCO Seabed 2030 project reported a mapping coverage of 24.9% when the latest GEBCO grid was released in spring 2023 (https://seabed2030.org/; https://www.gebco.net/).
Cited literature
1 Frederikse, T. et al. The causes of sea-level rise since 1900. Nature 584, 393-397, doi:10.1038/s41586-020-2591-3 (2020).
2 Mottram, R. et al. An Integrated View of Greenland Ice Sheet Mass Changes Based on Models and Satellite Observations. Remote Sensing 11, 1407, doi:10.3390/rs11121407 (2019).
3 Aschwanden, A. et al. Contribution of the Greenland Ice Sheet to sea level over the next millennium. Science Advances 5, eaav9396, doi:doi:10.1126/sciadv.aav9396 (2019).
4 Van de Wal, R. S. W. et al. A High-End Estimate of Sea Level Rise for Practitioners. Earth's Future 10, e2022EF002751, doi:https://doi.org/10.1029/2022EF002751 (2022).
5 Münchow, A., Padman, L., Washam, P. & Nicholls, K. W. The ice shelf of Petermann Gletscher, North Greenland, and its connection to the Arctic and Atlantic Oceans. Oceanography 29, 84–95, doi:10.5670/oceanog.2016.101 (2016).
6 Jakobsson, M. et al. The Holocene retreat dynamics and stability of Petermann Glacier in northwest Greenland. Nature Communications 9, 2104, doi:10.1038/s41467-018-04573-2 (2018).
7 Jakobsson, M. et al. The International Bathymetric Chart of the Arctic Ocean Version 4.0. Scientific Data 7, 176, doi:10.1038/s41597-020-0520-9 (2020).
8 Morlighem, M. et al. BedMachine v3: Complete Bed Topography and Ocean Bathymetry Mapping of Greenland From Multibeam Echo Sounding Combined With Mass Conservation. Geophysical Research Letters 44, 11,051-011,061, doi:10.1002/2017GL074954 (2017).
9 Jakobsson, M. et al. Ryder Glacier in northwest Greenland is shielded from warm Atlantic water by a bathymetric sill. Communications Earth & Environment 1, 45, doi:10.1038/s43247-020-00043-0 (2020).

Value staying current with hydrography?
Stay on the map with our expertly curated newsletters.
We provide educational insights, industry updates, and inspiring stories from the world of hydrography to help you learn, grow, and navigate your field with confidence. Don't miss out - subscribe today and ensure you're always informed, educated, and inspired by the latest in hydrographic technology and research.
Choose your newsletter(s)


