Subsea cable route surveying
Planning challenges
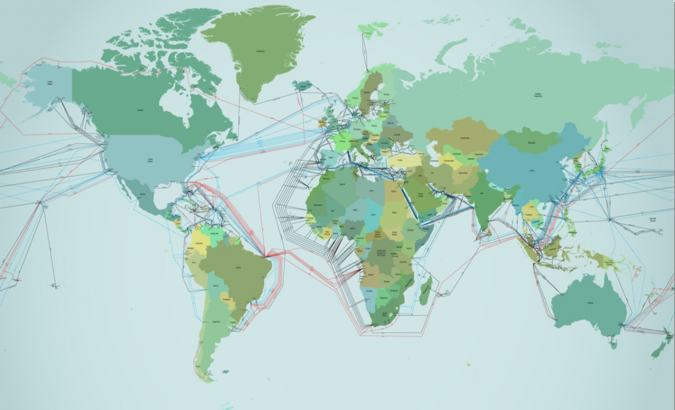
Almost all (99%) international data is transmitted by around 265 subsea cable systems connecting the world. The total length of subsea cables exceeds 1.6 million kilometres, and they can be found as deep as 8,000m. The cables, which can cost hundreds of millions of dollars, must generally be run across flat surfaces of the ocean floor, taking care to avoid coral reefs, wrecks, environmentally and politically sensitive areas and general geological obstructions. Diameters are generally no thicker than an average garden hose. Cable laying is an expensive operation and the cost is a function of the total length of cable, water depths and required protection and resulting cable types. This presents various planning challenges that surveying can help to address, as this article explains.
Prior to the installer laying the cable on the seabed, the survey contractor should provide the installer with the integrated geophysical and geotechnical data required to finalize the installation plan and procedures. Before the survey can start, a comprehensive desktop study is required to address the optimal route, the survey methodology and schedule of work. The primary study comprises the topography and type of seabed vs optimal or shortest routing. Based on the designed cable survey route, logistics and environmental parameters a route survey scope of work is prepared which is the basis of the survey plan.
Nearshore or offshore
Since subsea cables are laid shore to shore there will be nearshore, shallow (< 1500m) and deep water (> 1500m) survey requirements as part of the scope of work. The shallow-water survey covers typically a 500m – 1000m survey corridor where cable burial is proposed and which should be surveyed using a different range of sensors such as multibeam echo sounder, sub-bottom profiler, side-scan sonar and magnetometer. There are also nearshore sections (from 0 to approximately 3m) that need to be surveyed by divers that collect video footage and probe sediment thickness where survey vessels cannot operate. The survey sensors used in deep water are like those for nearshore surveys but with different specifications. A burial assessment survey using CPTs and coring is also required for ground-truthing the geophysical interpretation and finalization of the Burial Assessment Survey. In deep water beyond the proposed water depth for burial a single line of multibeam echo sounder data is collected to full ocean depth providing survey swaths of 3 x water depth up to 10 kilometres wide.
Besides the chosen survey instruments and techniques, timing is a third factor and should address the optimization of the survey plan as well as contingency plans to avoid any operations downtime, especially when the survey vessel is required to work in very remote areas. Survey timing is critical in areas affected by seasonal weather patterns, i.e. monsoons in Asia, hurricanes in the Caribbean, cyclones in South Indian Ocean, etc. and significant savings can be achieved by surveying during the ‘right’ time of the year. To achieve an optimum plan, particularly for surveying the offshore and deepwater section, an accurate segmentation of the survey disciplines based on the weather and environmental parameters has to be conducted and scheduled in the Plan of Work.
Shallow-water considerations
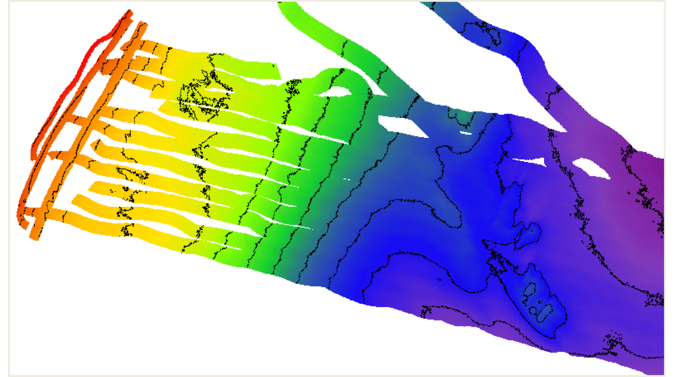
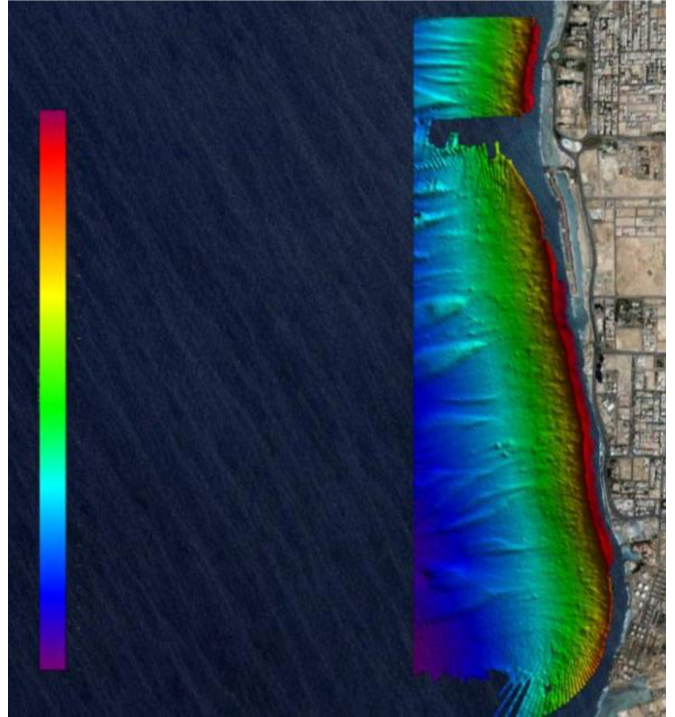
In addition to the weather and tidal behaviour of the coastal waters, the topography of the seabed sometimes makes the nearshore survey challenging. Achieving a full multibeam coverage of the shallow-water section results in a very tight line spacing design. A 20% overlap requires modification from 50m line spacing at 9m water depth to 25m line spacing at 5m water depth. The multibeam survey is not efficient in depths less than 5 metres as shown in Figure 2. Another challenge is observed when the coastal area has an immediate slope change and a very steep and narrow continental shelf, such as in remote pacific islands. In these cases, the survey cannot be undertaken in both directions and the equipment needs to be towed from nearshore to offshore or downslope to avoid collision with a rapidly shoaling seabed. This will result in additional transits and consequently increase in survey time (Figure 3).
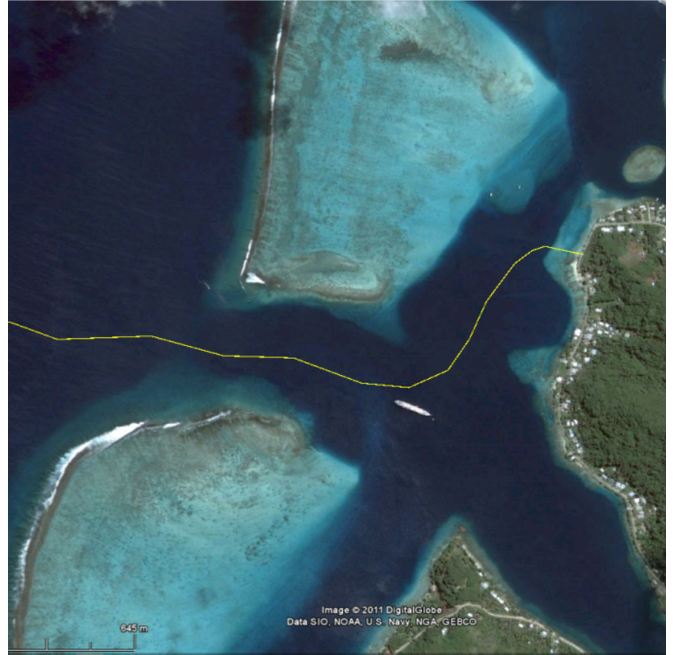
Lagoon environments comprise shallow waters, irregular seabeds and narrow high-energy entrances (Figure 4). In extended lagoons, the restrictive bathymetry of the coast approaches may be too complex for the larger offshore survey vessels. Thus, an extended inshore or nearshore survey may be required, which introduces more costs and mobilization risks for those sections of the survey. This may be mitigated by having a daughter survey craft on the main survey vessel, but this requirement must be considered before arriving on site!
Deepwater considerations
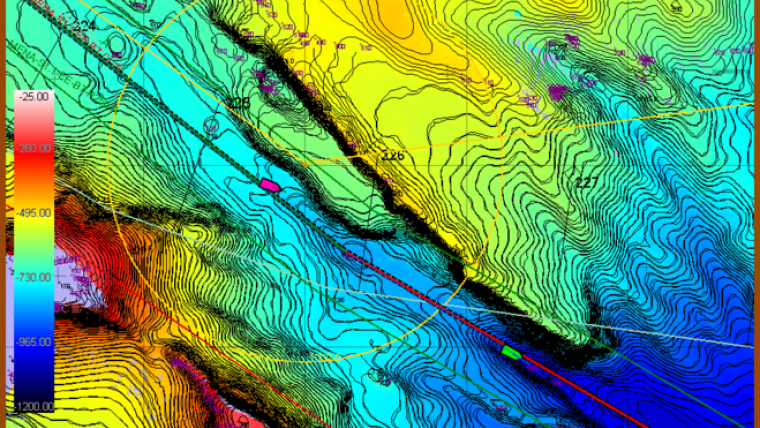
As water depths increase there are many parameters to take into consideration, for example, underwater currents affecting survey positional accuracy when operating deep tow sensors. This is critical for subsea object detection and positioning. Also important is how the Multibeam Echo Sounder (MBES) bin size is changed in different water depths. A Kongsberg EM122 (1⁰ x 1⁰ beam angle) gives a footprint at 500m of 9m and at 3000m of 50m.
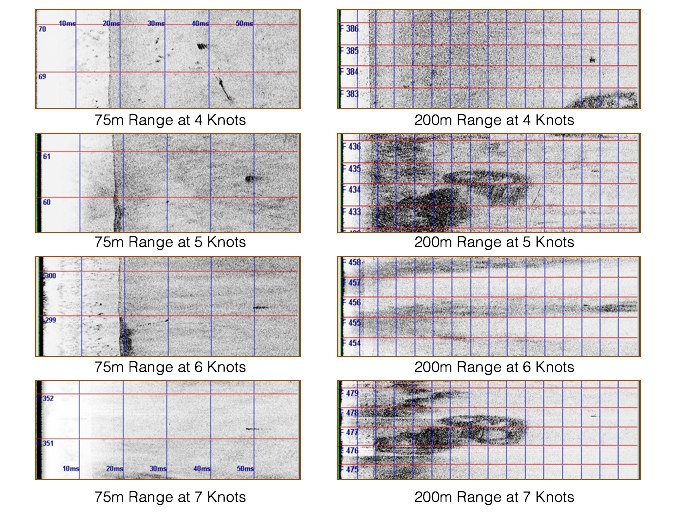
In addition to the MBES bin size, speed affects subsea target detection. Usually, there is additional backscatter or side-scan sonar data to detect targets that may not be resolved in the bathymetric data alone. A side-scan sonar investigation conducted by EGS shows how the detection of a one cubic metre target is affected by speed and range. A 1 m3 metal object was deployed on the seabed prior to running a series of lines past the object using a Klein 2000 Side-scan Sonar at a constant offset but different ranges and speeds. The results show that target recognition decreases as the speed and range increases. This experiment proves that especially in deeper water a survey speed of more than 3 to 3.5 knots will compromise the quality of the results (Figure 5).
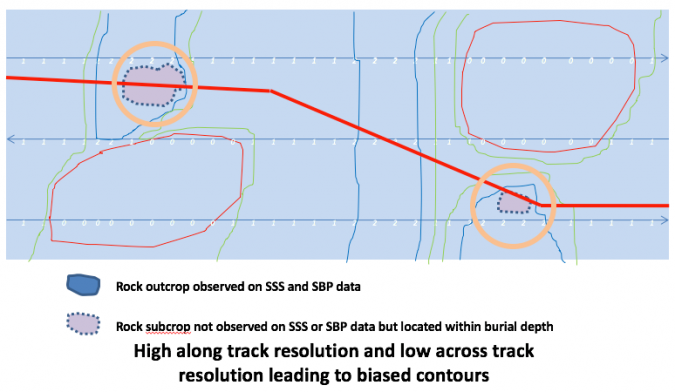
To create detailed isopachs, the sub-bottom profiler (SBP) data needs to be of sufficient density with cross line correlation. High data density is obtained by running closely spaced lines over the entire corridor, while cross-correlation is obtained by running cross lines. This is easily achievable during inshore surveys where typically 11 to 13 survey lines are required to get sufficient MBES coverage and when cross lines are required for correlation. However, it becomes problematic in deep waters when only 3 survey lines are required to achieve MBES data coverage and no cross lines are needed or specified allowing for objects to go potentially undetected. This is usually driven by economics rather than the desires of the onboard survey team. To mitigate against this route engineering is as far as possible carried out along survey lines. In areas of complex geology extra lines along the ‘in-field selected route’ may be run to confirm burial depths or the burial assessment may recommend ploughing with caution.
Tow fish considerations
Speed not only affects the target detection but it also determines the depth of towed systems. As the water gets deeper or slopes increase, to keep the tow fish flying as close as possible to seabed, the vessel speed has to be kept constant and as slow as possible. Using depressors and extra weights will help to submerge the tow fish as deep as possible but as soon as the vessel speed increases the tow fish may start to glide up from the seabed thus decreasing coverage and object detection capability.
As a rule of thumb, cable out length is three times the water depth (4,500m cable out in 1,500m depth). Depending on winch speed, the process of spooling out 4,500m of cable may take around 2 hours, which is lengthy process and will increase line turn times. To start a line the tow fish has to be deployed prior to the start point and can only be recovered when the tow fish has passed the end point of a survey line, meaning 2 x 4.5 kilometres of extra survey time with 4500m of cable out.
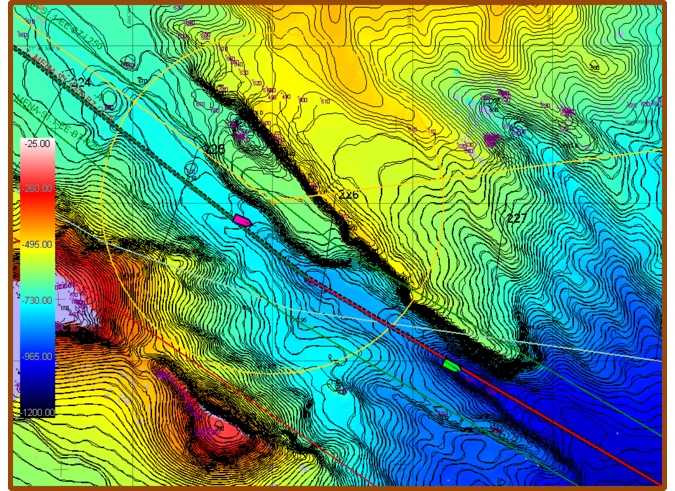
A single line turn with a towed sensor can take up to 4 hours in deep waters! Lines should be run separately if Alter Course (AC) points in the survey route exceed 10°, requiring the vessel to complete a full turn and sufficient run-in and run-out to ensure that no sub-quality ‘turn data’ is issued. Preliminary route engineering should be made to avoid unnecessary ACs in deep water to minimize lengthy line turns. Current can also have a major impact on survey operations as tow fish are pushed ‘off line’. If any in-fill survey is required and considering the run-in and run-out, line turns, etc. the survey time will be increased significantly (Figure 6).
Magnetometer considerations
Where the survey route crosses existing cables a magnetometer survey is required to accurately position the cable crossing if this is not observed on side-scan sonar to avoid plough incidents and cable damage. Magnetometers can be affected by the steel hull of the survey vessel, the (steel armoured) tow cable and steel USBL beacon casings. The solution is to tow magnetometer far enough from the vessel, use Kevlar tow cable and position the USBL beacon a set distance from the magnetometer and apply offsets accordingly. This is easily done for inshore surveys but becomes much more difficult in deeper waters.
As an aid to flying the magnetometer in deeper waters it may be piggybacked to the side-scan sonar so height can be controlled more easily than relying on altimeters / depth sensors. As a rule of thumb, a side-scan sonar should be flown at an altitude of 10-15% of sonar range i.e. for 200m range, the SSS should be flown at 20m above seabed. However, at 20m above seabed, the magnetometer would only detect large objects such as wrecks. So, extra magnetometer specific lines have to be run with the instrument closer to seabed to detect the smaller ferrous content of a buried cable increasing survey times and costs (Figure 7).
Data management
Every cable route survey deals with multi-gigabytes of raw data on a daily basis. The survey results and reports are generated in real-time on board and are used for analysis of the proposed survey route. The data will be used to provide an on-board post survey route (for installation) and the cable and installation parameters will be engineered at this stage. Design criteria can be sent to the manufacturing factory during the survey. Cable engineering is a time-sensitive process, the faster the survey results are made available, the quicker they can be used to manufacture the cable. However, telemetry of data to shore is expensive. Online real-time monitoring is critical on board the survey vessel to reduce the potential of having to transit back to problematic areas to conduct re-route or deviation surveys.
Conclusion
Cable route surveys present different and sometimes unique challenges on a project by project basis. A high-quality desktop study is required prior to any planning and operations to best prepare for any eventuality. A properly defined scope of work is a vital part of the process which helps to select the most appropriate survey tools for expected survey and cable route conditions. Best survey practice consistent with the acquisition of high-quality data, with an ability to modify a survey plan in the field are vital. Onboard processing and data presentation are key for timely decision-making and product delivery for manufacture. If field works are executed during optimum weather seasons, the costs of surveys can be reduced significantly. However, financial pressures may dictate that surveys be conducted in unfavourable conditions in favour of a more successful installation.

Value staying current with hydrography?
Stay on the map with our expertly curated newsletters.
We provide educational insights, industry updates, and inspiring stories from the world of hydrography to help you learn, grow, and navigate your field with confidence. Don't miss out - subscribe today and ensure you're always informed, educated, and inspired by the latest in hydrographic technology and research.
Choose your newsletter(s)


