Exploring shallow lagoons with USV mapping technology
Autonomous and uncrewed mapping of the unique ecosystem of Gialova Lagoon
Unmanned surface vehicles (USVs) are increasingly being used for the mapping and management of shallow-water environments such as lagoons, rivers and estuaries, due to their economic and ecological benefits. The Gialova Lagoon wetland in south-west Peloponnesus, Greece, is particularly difficult to navigate using crewed vessels and was therefore studied using a USV to identify the bathymetry, morphology and submerged aquatic vegetation coverage of the lagoon’s floor. The USV platform was equipped with various devices, including sidescan sonars, single- and multibeam echosounders, environmental sensors and waterproof cameras. The USV successfully navigated the shallow waters of the lagoon and a ground-truthing survey was conducted based on the collected data.
The increasing use of uncrewed and autonomous surface vessels for the exploration, mapping and management of extremely shallow coastal and transitional waters is helping researchers to discover the natural processes taking place in these challenging shallow underwater environments (lagoons, near-shore waters, estuaries, rivers, harbours, artificial lakes, etc.). These environments are largely unmapped, as extremely shallow sections are inaccessible to manned vessels. USVs can offer significant economic and time savings and a single USV can replace a manned vessel as it can navigate extremely shallow environments. Moreover, USVs use eco-friendly survey methods and significantly reduce the impact on the ultra-shallow and transitional environments, in particular ‘fragile’ environments protected under international conventions.
Survey area and objectives
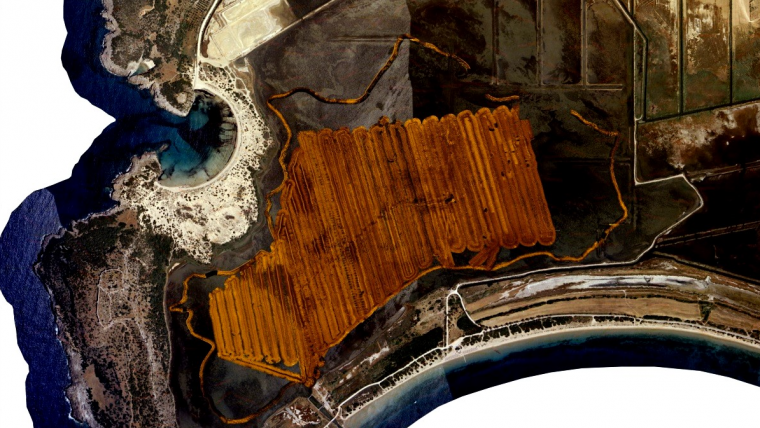
The Gialova Lagoon wetland is one of the few remaining Important Bird and Biodiversity Areas (IBAs) along the south-west coast of Greece and is designated a Special Protection Area (Fig. 1). It is also a Natura 2000 area and fulfils the Ramsar Convention criteria for wetlands. It has a water depth of less than one metre, covers an area of about 2.5km2 and is connected to the adjoining Navarino Bay via a small artificial channel. Its extremely shallow waters make it very difficult to navigate using a crewed vessel, which is why a USV was chosen, due to its ability to navigate waters as shallow as 40cm.
The main purposes of the survey were to identify the bathymetry, morphology and submerged aquatic vegetation coverage of the lagoon’s floor and visualize the spatial distribution of its sedimentological characteristics, by means of marine geophysical techniques onboard the USV.

USV platform specifications
USVs have the advantage of being able to host various types of equipment, such as sidescan sonars, single- and multibeam echosounders, a wide variety of environmental sensors (temperature, salinity, dissolved oxygen, chlorophyll-a) and waterproof cameras. In this study, the USV platform, which was provided by the Intelligent Machines Single Member P.C., along with the accompanying software, was set up to meet the specific requirements of the area. Specifically, the USV platform type was that of a catamaran, offering greater stability in lateral movements. Its small size (1.7m long and 0.6m wide) and light weight (less than 15kg) made it easy to transfer, while it was able to support equipment weighing over 15kg (Fig. 2).
The USV was equipped with the following systems: (i) a high-frequency (455 and 800kHz) sidescan sonar (SSS) and single-beam echosounder (SBES) system (Lowrance – Elite-5 Ti) for the insonification of the lagoon’s bottom, (ii) a digital high-resolution camcorder placed in a waterproof case for the ground-truthing data (real-time records and snapshots) and (iii) a real-time kinematic GPS (RTK GPS) (Emlid Reach M2) with greater than 10cm accuracy, used to position the USV relative to a base station on shore.

Field survey
In a preliminary phase, an imprint of the lagoon’s perimeter between the 40cm and 60cm isobaths was made onboard a small fishing boat using the high-resolution Lowrance, to delineate the survey area. The Lowrance operation pulse frequency was chosen at 455kHz, due to the extremely shallow and high turbidity waters. After setting the area boundaries, tracklines were designed in the Mission Planner software (provided by Intelligent Machines Single Member P.C.). The USV operator was therefore able to pre-programme the waylines for the platform to follow. The total length of the SSS tracklines was about 29.5km and the spacing between surveying lines was 30m, offering a 10m overlap between adjacent sidescan records. The USV operated at a speed of 1m/s (≈ 2 knots) for about nine working hours in total.
Any difficulties encountered during the USV survey were instantly resolved. The main difficulties were plants and sticks becoming entangled in the propellers and obstacles on the programmed route. To deal with these, a plastic net was positioned to protect the propellers and the route was redesigned or the course was changed manually. In some parts of the lagoon, the aquatic vegetation rose above the water surface or was floating, making it impossible for the USV to enter these areas.
Based on the collected SSS data, a ground-truthing survey was designed and conducted that consisted of sediment and submerged aquatic vegetation sampling.
USV performance – line-keeping capability
The log files generated by the mission planning software were used to assess the auto-tracking performance of the USV along the planned waylines. This can be evaluated by examining the across-track distance of the USV compared to the planned wayline (x-track) and its heading over time. The x-track mean value for the full survey was close to zero with a standard deviation of 5cm and maxima of 40cm, while the mean deviation of the heading was 2 degrees. An example of a log showing x-track and heading versus time is shown in Figure 3. The performance of the USV was considered satisfactory in terms of auto-tracking fidelity, executing smooth heading (yaw motion) and response to wind and wave drifting forces.

Data processing
The geophysical data was processed at the Laboratory of Marine Geology and Physical Oceanography (Oceanus-Lab) of the Department of Geology, University of Patras.
Bathymetry
The SBES bathymetric data from the Lowrance echosounder was processed in the Reef Master software environment. Other information acquired by the Lowrance echosounder was the first and second bottom echo returns, which are associated with seafloor ‘roughness’ and ‘hardness’, respectively. Notably, the shape and strength of the echoes depended on the morphological and lithological features of the lagoon’s floor, such as hardness, sediment grain size, compactness and roughness of sediment and submerged aquatic vegetation (SAV).
Lagoon’s floor classification
The sonographs (SSS records) were imported into the Reef Master software to apply radiometric and geometric corrections and create a sidescan sonar mosaic. Two approaches were used to classify the lagoon’s floor in distinct floor types based on sediment characteristics and SAV (Fig. 4).
A manual classification of the lagoon floor was made qualitatively using as a background the SSS mosaic, by means of visual observation and verified by the underwater photographs and the video recordings extracted from the camcorder as well as the sediment and SAV sampling. More specifically, classification was made depending on the lagoon floor’s acoustic type characteristics (low or high backscatter intensity and texture characteristics) and the presence or absence and the patchy or continuous spatial distribution of all components recorded in the lagoon’s mosaic (sediment types, submerged vegetation, drainage embankments, etc.).

As a second approach to the floor classification, an unsupervised acoustic classification of the collected SSS data was made by the Matlab toolbox SonarClass, an acoustic classification system based on analysing local backscatter texture characteristics of swath sonar data. The unsupervised classification was made taking into consideration the areas between 3–15m floor range of each SSS recording channel. Specifically, 3m from the nadir zone and 5m from the edges were removed due to acoustic noise in the acquired SSS data.
All maps were generated using ArcGIS 10.6 software and the geographical coordinate system used was GCS_WGS_1984 projected in UTM Zone 34N. Ortho-corrected aerial photographs acquired during 2007 and 2009 and the Google Earth engine were used as a background.

Main results
In total, geophysical data was collected from an area of 0.85km2 in the extremely shallow environment of Gialova Lagoon. The sidescan sonar mosaic is presented in Figure 5, exhibiting considerable seafloor type spatial heterogeneity.
The detailed bathymetry map showed that Gialova Lagoon is an extremely shallow-water body with a maximum water depth of 0.70m. Two very shallow depressions (basins) can be seen, one in the south-west and the other in the eastern part of the lagoon. An elongated ridge can also be seen, running from east to south-west in the centre of the lagoon, and a less visible ridge running from north to south (Fig. 6).
The SSS mosaic classification was made based on the reflectivity and the alternation of the reflectivity of the sonar records (texture) and resulted in six acoustically distinct types (Figs. 5 and 7). The morphological characteristics of the lagoon’s floor were revealed to be comprised mostly of submerged aquatic vegetation, with a homogenized or patchy spatial distribution, followed by fine sediments, bivalves, ridges and drainage embankments. The spatial distribution of the backscatter coincided well with the morphology and the subaqueous vegetation of the lagoon.
The unsupervised classification results correlated very well with the acoustic type (AT) spatial distribution, as defined by the manual classification procedure, confirming that the lagoon’s floor is most accurately classified in six distinct types (Figs. 5 and 7). AT 1 exhibits the lowest reflectivity in the lagoon with a patchy acoustic pattern that is locally more intense. On the contrary, AT 2 shows the highest reflectivity in the lagoon floor with a patchy pattern and is restricted to the western end of the lagoon. AT 3 through AT 5 represent intermediate reflectivity types between AT 1 and AT 2. AT 6 has a linear arrangement and represents a man-made ridge in a SW-NE direction. The ground-truthing survey showed that the reflectivity of acoustic types was mainly affected by the submerged aquatic vegetation density.

Conclusion
The USV survey revealed the bathymetry and floor classification of the lagoon in terms of morphology, sediment granulometry and submerged aquatic vegetation. A USV is a very effective tool for mapping extremely shallow lagoons and hard-to-reach areas and, in the case of Gialova Lagoon, it successfully met the requirements of the field survey. Its small size and light weight, ability to support various types of equipment and sensors, convenient assembly and disassembly, neutrality to local weather conditions and ability to cover large areas within a few hours at a low cost, are just some of the advantages. Most importantly, USVs can be considered as the only means of surveying extremely shallow-water environments and land-locked water bodies, since conventional survey vessels are often unsuitable, inefficient or incapable of completing a successful survey in such environments.
As USVs have zero emissions, the overall carbon footprint of a USV survey is extremely low. The overboard discharge of pollutants and fuel from crewed survey vessels should also be considered. Moreover, conventional research vessels are noisy with significant impacts on marine life. USVs have none of these problems, making them ideal for surveying fragile environments that are vulnerable or sensitive to change or easily damaged, such as lagoons, estuaries and lakes. These advantages become even more critical when it comes to surveying environments that are governed and protected by international conventions (Natura 2000, Ramsar).

References
Fakiris, E., Papatheodorou, G. (2009). Sonar Class: A MAΤLAB toolbox for the classification of side scan sonar imagery, using local textural and reverberational characteristics. In: Proceedings of the 3rd International Conference on Underwater Acoustic Measurements: Technologies and Results (Εds. Papadakis and Bjorno) Nafplion Greece, 21–26 June 2009, Vol. III, pp. 1445–1450.

Value staying current with hydrography?
Stay on the map with our expertly curated newsletters.
We provide educational insights, industry updates, and inspiring stories from the world of hydrography to help you learn, grow, and navigate your field with confidence. Don't miss out - subscribe today and ensure you're always informed, educated, and inspired by the latest in hydrographic technology and research.
Choose your newsletter(s)


