GIS in Offshore Pipeline/Asset Inspection Surveys
Fugro Survey Limited undertake a wide variety of offshore pipeline/asset inspection surveys for energy companies throughout the world, using side-scan sonar and multi-beam echo sounder data to ascertain the condition of pipeline networks, umbilicals and other structures on the seabed. One of many very recent and significant developments, and the focus of this article, has been the use of GIS in data QC, analysis and delivery of data.
This article focuses specifically on annual inspection surveys undertaken for NAM (Nederlandse Aardolie Maat-schappij BV) in the Dutch Sector of the Southern North Sea. It looks at the different processes involved in such a survey and how GIS has been used to streamline and integrate these processes, from fieldwork through to delivery of the final products.
Data Acquisition
The NAM annual inspection survey is undertaken using a dedicated survey vessel to acquire side-scan sonar and multi-beam echo sounder data. There are two main component parts to the survey: ‘pipeline inspection survey’ and ‘detail survey’. The ‘pipeline inspection’ involves inspection of individual pipelines or umbilicals and during it the side-scan sonar sensor is towed along the length of the pipeline at an optimum position from which to obtain a high-resolution sonar image of the pipeline and adjacent seabed. This data is analysed to identify features along the pipeline such as exposures, spanning pipe and items of debris that may be interacting with the pipeline, as well as any naturally occurring seabed features such as boulders and sandwaves.
The second part, the ‘detail survey’ involves specific survey of seabed structures present both along and at the ends of the pipelines, i.e. platforms, wellheads, valves etc., again utilising both side-scan sonar and swathe bathymetry data. In this case, a ‘box in’ survey is performed around the structure to enable inspection of both the structure in question and the surrounding seabed.
Data Interpretation
The two component parts of the survey are interpreted in differing ways, using software that has evolved to suit both types of survey. A team of qualified geophysicists and data processors are responsible for interpreting the data. Pipeline-inspection data is interpreted using specialised software whereby all features identified are ultimately projected onto the database position of the pipeline and expressed in terms of their KP (kilometre post) position along the pipeline; they are then output in a proprietary database format. In contrast, the ‘detail surveys’ performed around the seabed structures are interpreted and presented in a spatially referenced manner.
Side-scan sonar mosaics are created and used together with detailed bathymetry to produce a map of the manmade and naturally occurring features on the seabed within the area surveyed. The results are output as raster geo-referenced tiffs of the side-scan sonar mosaics, contoured swathe bathymetry and an overlay of geophysical interpretation of the data output in DXF format.
Integration and QC
Although the methodologies used for the two types of survey outlined above differ, the components need to be interpreted and presented as one. For example, the seabed surrounding a platform will be surveyed during a ‘detail survey’ and any pipelines etc entering the platform will be clearly visible in this data. In addition, many of these pipelines will also have undergone specific ‘pipeline inspection’. Clearly, seamless integration between the two datasets is essential for project success and for NAM to get a complete picture of the condition of their sub-sea assets. The GIS environment has proved the ideal setting for this integration.
Utilising tools built within ESRI
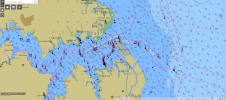
ArcMap, the geophysicist is able to operate in a spatially referenced environment where all acquired data types and interpretations are available for viewing. Specific tools provide the ability to make on-the-fly adjustments, to visually review changes and then to write them onto the database. This allows a high level of QC and ensuring that seamless integration is achieved between the ‘pipeline inspection’ and ‘detail survey’ components.
Delivering Results
The role of GIS extends further than its use as an interpretation/integration/QC tool: it also embraces presentation of the final results. The prime digital deliverable for the NAM annual inspection is the supply of an ArcGIS geodatabase per pipeline inspected. This is constructed during the reporting phase of the project, after interpretation and presentation has been completed, and is made up from a number of different building blocks which are ultimately integrated into the client’s Database for asset-management purposes. The components of the Geodatabase for each pipeline include a features/events database along a pipeline, seabed features and bathymetry charts, sonar mosaics, database pipeline files and platform/sub-sea structure outlines, all of which are spatially referenced and plotted in their as-found positions. Other tools have also been developed within ArcMap. One such is a template that generates 12km-plan-view alignment charts from the data. This gives clients the option also to view spatially referenced data in a more traditional way.
Conclusion
The use of the GIS technology has impacted on all stages of the project, from planning through to data acquisition, data processing and interpretation, and of course in the delivery and utilisation of the results. The GIS approach then, is far from just being simply a convenient way to present results. It has proved to be a valuable tool for everyone involved in any stage of the project. From the geophysical interpreter who can make the best possible assessment of the data by accessing all components in a highly efficient working environment through to the data processor, able to automate processes using the specially developed tools, and ultimately to the end users within NAM who can quickly access the information they require. The benefits to projects such as this are clear and the expertise within Fugro Survey to ensure that the GIS tools continue to develop and evolve, will undoubtedly see more and more offshore survey projects adopt this type of approach.

Value staying current with hydrography?
Stay on the map with our expertly curated newsletters.
We provide educational insights, industry updates, and inspiring stories from the world of hydrography to help you learn, grow, and navigate your field with confidence. Don't miss out - subscribe today and ensure you're always informed, educated, and inspired by the latest in hydrographic technology and research.
Choose your newsletter(s)


