Long-term observations of beach topography and nearshore bathymetry
A long-term and multisensor dataset of topobathymetric surveys and accompanying environmental controls
To understand coastal change and anticipate what our future coast will look like, scientists carry out regular field surveys in the form of beach profiles and digital elevation models (DEMs). Until now, accessible data has remained scarce, particularly for the shoreface (the subtidal extension of the beach), where it is more difficult to collect data. With a relatively sheltered position, Porsmilin beach in Brittany (France) has been the scene of numerous topobathymetric surveys, and the dataset has recently been made available.
The Porsmilin Beach survey programme
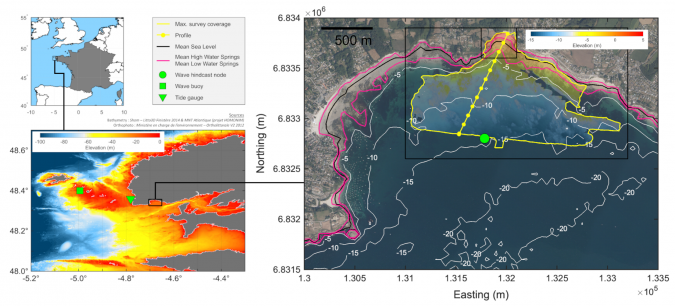
The Porsmilin beach survey programme was launched in January 2003 by the European Institute for Marine Studies at the University of Brest and continues today in the framework of the French coastal observation service SNO-DYNALIT. It initially consisted of frequent (approx. monthly) surveys of a cross-shore profile measured at low tide. From 2008, it evolved to also incorporate recurring high-resolution (0.5m) subaerial and subtidal DEMs, which were obtained using a combination of remote sensing techniques and whose spatial coverage encompasses the regions of significant morphological change (Figure 1).
In 2019, after 16 years of the Porsmilin survey programme, the dataset was completely revamped and unrestricted access to the complete and archived data was provided. This allowed for the incorporation of recent advances in geomorphic processing and validation techniques, providing consistent and well-documented data that can be easily reused by others for their analyses (Bertin et al., 2022a). The dataset was also supplemented with wave and tide data covering the monitoring period, which was provided by external organizations.
The field site at Porsmilin
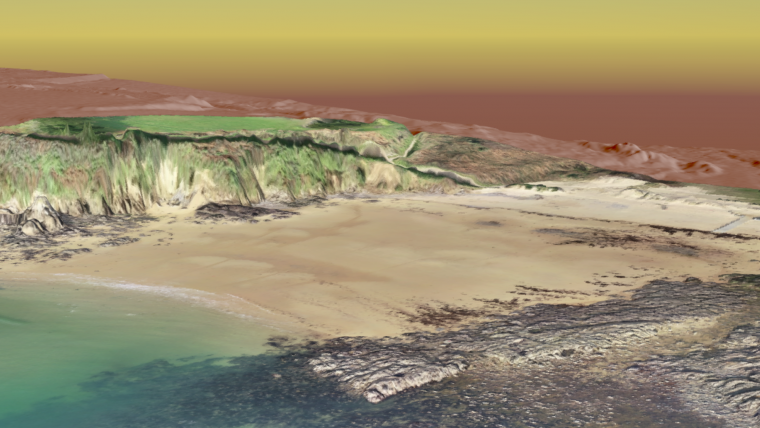
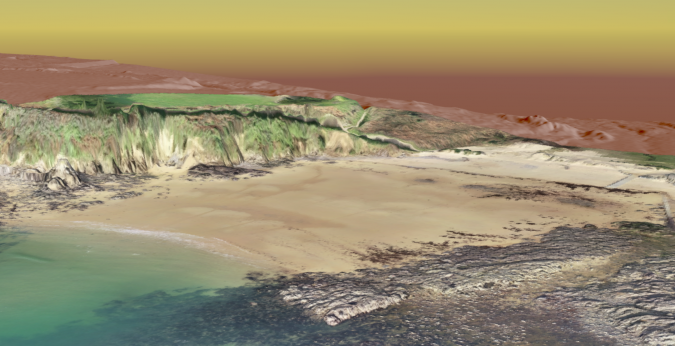
Situated at the entrance to the Bay of Brest, Porsmilin is a narrow (200m-long), moderately indented, macrotidal (5.7m mean spring tidal range), embayed beach nested in the wider Bertheaume embayment and facing south-southwest (Figure 1). The sandy beach is constrained on both sides by cliffs and bedrock reef extending offshore, providing stable zones for assessing topobathymetric measurements. The back beach is separated from a brackish water marsh by a small coastal dune.
The wave climate is highly energetic in this part of the Atlantic Ocean called the Iroise Sea (mean Hs ~2.0m, estimated in 60m water depth using the Pierres Noires wave buoy). However, because of a prominent continental shelf with numerous islands and reefs that affect wave propagation, wave exposure at the coast is highly heterogeneous. Waves are significantly reduced when they reach Porsmilin (mean Hs ~0.7m, estimated in 15m water depth), which tends towards the lower-energy low-tide terrace beach state.
Significant changes to the beach occurred over the duration of the monitoring programme, the most notable being during the 2013–2014 boreal winter, which was among the most energetic since at least 1948 for most of the European Atlantic coast. Of particular note was the erosion of the small coastal dune and overwash in January 2014, followed by man-made reprofiling and consolidation of the dune embankment at a more landward position.
Field surveys and validation methods
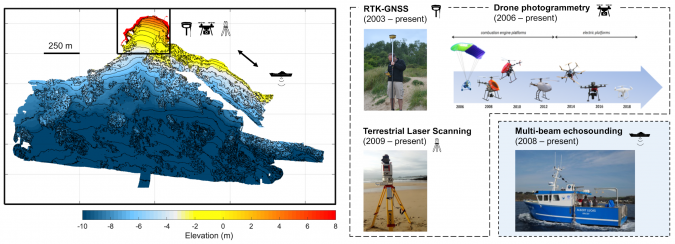
Figure 2 presents the different survey methods used to monitor beach and shoreface evolutions. The survey programme until 2019 produced 253 central cross-shore profiles of the subaerial beach obtained using RTK-GNSS (GPS), six topographic GPS DEMs and 14 topographic DEMs. Orthophotos were also obtained using uncrewed aerial vehicle (UAV) images and Structure-from-Motion (SfM) photogrammetry plus 43 topographic DEMs using terrestrial laser scanning (TLS) and 24 bathymetric DEMs obtained using a boat-mounted multibeam echosounder (MBES). Topographic surveys are generally timed to coincide with spring low tides and bathymetric surveys are undertaken during spring high tides, to optimize surface coverage and to produce some overlap. Topographic and bathymetric DEMs collected concurrently were merged to produce 11 fusion DEMs covering both subtidal and subaerial regions (Figure 2).
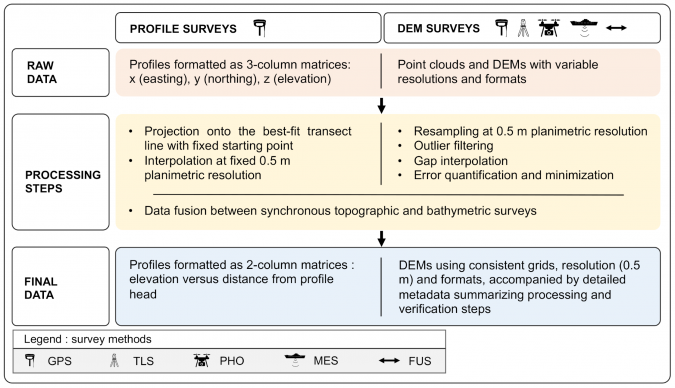
With different survey methods and varying personnel, the initial data was generally inconsistent. To allow comparisons between surveys while contributing to homogenizing final quality, data harmonization (Figure 3) consisted of resampling all profiles and DEMs at a fixed spatial resolution (0.5m) and filtering outlier DEM cells and filling gaps using custom methods.
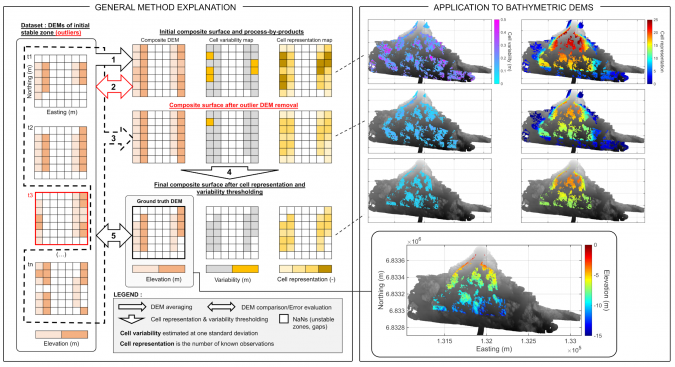
As a final step, DEM quality was quantitatively assessed, with any corrections applied through co-registration, using purpose-built ground truths of invariant features (stable zones identified through photo interpretation and roughness analysis). Figure 4 documents the preparation of such a ground truth for assessing the vertical error in bathymetric surveys. The ground truth was obtained by fusing (standard averaging) available DEM surveys iteratively to enhance ground truth quality. The resulting bathymetric ground truth counted over 130,000 known elevations with a cell vertical precision of 0.07m (determined as one standard deviation between independent measurements, averaged over all cells). This is a good proxy for the overall precision of the dataset, as it characterizes the ability to effectively replicate measurements over time.
DEM comparison with the ground truth enabled the provision of total error estimates for each survey and ensured altimetric consistency throughout the duration of the monitoring programme, these being important prerequisites for allowing reliable change detection. The evaluation shows that all survey methods were able to produce high-quality data, shown by bias and precision mostly below 0.1m. No degradation of data quality resulting from measuring submerged topographies was observed. The method description and applications to both vertical and horizontal error evaluation at Porsmilin are presented in Bertin et al. (2022b).
A dataset for coastal research
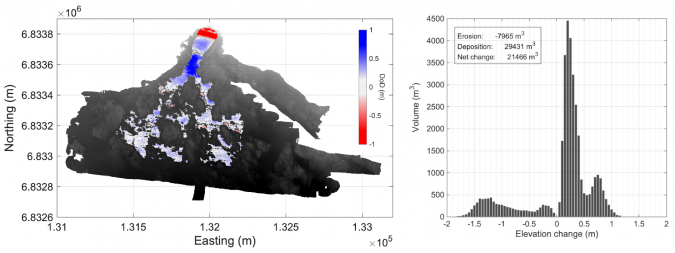
Using the dataset, subaerial sediment dynamics from event to multi-annual timescales can be assessed through sediment budget analyses, complemented since 2008 by approximately bi-annual bathymetric surveys capturing sediment transfers with the shoreface. In Figure 5, we present a DEM of differences (DoD) between two fusion DEMs (19/04/2011 and 30/01/2014, respectively). This DoD shows the impact of the very stormy start of the year in 2014 in comparison to previous beach states. The intertidal beach was severely eroded (vertical encroachment exceeding one metre, shown in red), while sand was deposited on the upper shoreface (shown in dark blue), corresponding to depths of five to eight metres below MSL. A net sediment imbalance between eroded and accreted regions of the beach and shoreface can be observed, which may result both from the erosion of the dune and the onshore transport of sand from deeper regions during the storm.
Conclusions
The availability of a rare dataset documenting beach and shoreface evolution over more than a decade, together with growing incentives for open access in science, has motivated novel research on methods to reconciliate surveys of variable and unknown quality before their reliable geomorphic exploitation. The method developed makes it possible to assess DEM quality and minimize registration errors between repeated geomorphic surveys using only the available data and invariant features at the study site. At Porsmilin, our evaluation shows that fine-scale geomorphic change detection levels can be achieved in the long term using various survey methods. Besides coastal applications, the dataset should interest a growing community of scientists looking for benchmarks for assessing other datasets and remote sensing techniques.
References
Bertin, S., Floc’h, F., Le Dantec, N., Jaud, M., Cancouët, R., Franzetti, M., Cuq, V., Prunier, C., Ammann, J., Augereau, E., Lamarche, S., Belleney, D., Rouan, M., David, L., Deschamps, A., Delacourt, C., & Suanez, S. (2022). A long-term dataset of topography and nearshore bathymetry at the macrotidal pocket beach of Porsmilin, France. Scientific Data, 9(1), 79. https://doi.org/10.1038/s41597-022-01170-3
Bertin, S., Jaud, M., & Delacourt, C. (2022). Assessing DEM quality and minimizing registration error in repeated geomorphic surveys with multi‐temporal ground truths of invariant features: Application to a long‐term dataset of beach topography and nearshore bathymetry. Earth Surface Processes and Landforms. https://doi.org/10.1002/esp.5436
Jaud, M., Delacourt, C., Le Dantec, N., Allemand, P., Ammann, J., Grandjean, P., Nouaille, H., Prunier, C., Cuq, V., Augereau, E., Cocquempot, L., & Floc’h, F. (2019). Diachronic UAV photogrammetry of a sandy beach in Brittany (France) for a long-term coastal observatory. ISPRS International Journal of Geo-Information, 8(6), 267. https://doi.org/10.3390/ijgi8060267

Value staying current with hydrography?
Stay on the map with our expertly curated newsletters.
We provide educational insights, industry updates, and inspiring stories from the world of hydrography to help you learn, grow, and navigate your field with confidence. Don't miss out - subscribe today and ensure you're always informed, educated, and inspired by the latest in hydrographic technology and research.
Choose your newsletter(s)


