
Safe Navigation with Uncertain Hydrographic Data
The Representation of Data Quality in the IHO S-101 Data Model
Despite the best efforts of Hydrographic Offices (HOs) around the world, the ENCs that are on the market today do not always depict the real world as accurately as would be desired. This situation arises because gathering detailed hydrographic data is slow and consequently, ENCs (and paper charts) are compiled from multiple data sources, some modern and comprehensive, some old (even ancient) and others from all stages in between. When the IHO developed the S-57 standard this situation was recognised and the quality of survey data used to compile ENCs had to be encoded within a composite data quality indicator ‘Category of Zone of Confidence’ (CATZOC).
However, a questionnaire issued by the IHO Data Quality Working Group (DQWG) and completed by over 600 mariners worldwide clearly indicated that CATZOC was not well understood, not liked, nor allowed mariners to adequately make decisions based on data quality. The DQWG has, therefore, rejected CATZOC for S-101 and is developing a new and improved method to depict data quality.
What Do We Mean by Data Quality?
In this context data quality indicates how well the chart (i.e. the ENC) agrees with reality. This is achieved by meta information attached to either the entire dataset, a specific area or individual features. The meta information includes:
• measurement uncertainty (e.g. the variation between similar measurements at the same location);
• completeness (e.g. seafloor coverage);
• currency (e.g. temporal degradation).
Measurement uncertainty can relate to position (2D), vertical (1D), horizontal distance (1D) and orientation (1D) information, at a 95% confidence level. This measurement uncertainty should include all relevant variations due to the measurement procedure, processing errors and visualisation. Uncertainties due to completeness and currency do not lend themselves to such statistical definitions and are therefore handled separately.
Data Quality Information in Current ENCs
S-57 allows the quality of survey data to be recorded in several so-called metadata attributes. However, most cannot be visualised. They can be discovered if the mariner uses functions in the ECDIS to interrogate the data but this severely limits their usefulness. The only data quality information that can be visualised is CATZOC and this is mandatory. This is a single composite indicator for bathymetry: it takes vertical and horizontal uncertainty along with an assessment of the completeness of the survey, and combines these via a simple algorithm to place the bathymetry in one of 5 categories.
Providing all the individual indicators meet the required standards, the area of the ENC can be allocated the relevant ZOC. Once a ZOC category has been assigned this can be displayed in the ECDIS as a series of stars overlaid on the ENC – the greater number of stars the better the survey (Figure 1). Unfortunately, replies to a comprehensive questionnaire issued to mariners by the DQWG made it clear that CATZOC is not adequate since mariners do not like the visualisation (i.e. the stars), understand it nor can they make adequate decisions based upon it.Figure 1: Visualisation of CATZOC. Four stars represent a CATZOC B.
 In addition, CATZOC cannot indicate temporal degradation. The start and end dates of the survey can be encoded, but these cannot be visualised. This inability to cater for changing seafloors is recognised as a major weakness as is illustrated by the Goodwin Sands where the bank moved 1,500m between surveys (2.4m per week), resulting in drying heights where depths of 20m were available 12 years earlier (Figure 2). The ENC has a CATZOC of A1 based on the quality of the latest survey. However, this survey was completed in September 2009. Today, it should be expected that the banks are several hundred metres from where they are charted yet the CATZOC of A1 implies they are accurate to within 5m. Such a definition does not help the mariner and it is hoped to improve on this with the new system.
How Will Data Quality be Described in the Future?
Because of the problems described above and despite the effort and resources dedicated by HOs to populate CATZOC, the DQWG has agreed that it will not be used in the future S-101 ENC product specification. The DQWG realises that this decision inevitably carries the risk of wasted efforts of populating CATZOC and it will do its best to find an automatic mapping from CATZOC to the new S-101 quality indicators, but this comes without guarantees: the new indicators have to be useful and easy for the mariner to understand.
While the final display will need to use a new composite indicator, how this will be made is not yet clear. What the DQWG has looked at so far are the component parts of any composite and it is the intention that future ENCs will not carry the final composite indicator but will hold the elements. The composite indicator will then be made by combining these in the ECDIS using algorithms which are yet to be devised. Also, it is quite probable that the final composite will have an option to contain information from the environment and the ship as well (e.g. tides, draft) which obviously cannot be included in the ENC.
To help the DQWG devise the best form of visualisation, the University of Southern Mississippi (USM) has agreed to study this problem. This study will involve developing sample cases with data of different types (e.g. old data, mobile seafloors, rocky seafloors) and testing these on a modified ECDIS with practicing mariners.
In order to serve every mariner with the level of information that he needs, the DQWG proposes a recently published concept in cartographic literature. The top level is the composite indicator. This can be interrogated to determine its component parts and these parts can also be interrogated to discover their components. It is thought that the mariner may be interested in the finer detail when planning a route, but will probably revert to viewing the top level or dispense with viewing the data quality entirely during navigation.
How May This be Implemented in the S-101 Data Model?
Data quality will be divided between three main so-called meta-features in the current draft version of S-101. The three main meta-features are QualityOfBathymetricData, QualityOfNonbathymetricData and QualityOfSurvey. QualityOfBathymetricData provides an assessment of the overall quality of bathymetric data. Within this, an attribute called FullSeafloorCoverageAchieved indicates whether the seafloor was surveyed in a systematic way likely to fully cover the seafloor with observations.
In IHO publication S-44, a significant feature is defined as any object, whether manmade or not, projecting above the sea floor, which may be a danger for surface navigation. The ability to detect significant features will be encoded using a complex attribute called FeaturesDetected that contains simple attributes. These indicate the minimum size of detected features and if their least depth was measured. After all, it is possible that objects are discovered by side-scan sonar that are not sounded to determine the depth.
The mobility of the seafloor will be encoded using an attribute called CategoryOfTemporalVariation. This will cater for expected regular change (e.g. the Goodwin Sands), but will also have a value to alert users to a sudden change like that caused by a hurricane or underwater earthquake.
QualityOf Non bathymetric Data is also a complex attribute which provides information on the quality of navigational marks, etc. Quality Of Survey can apply to bathymetry (e.g., an underwater rock), non-bathymetry (e.g., navigational aids) or a combination of these (e.g., a Lidar survey). Separating the Quality Of Survey from the Quality Of Bathymetric Data avoids the Goodwin Sands dilemma since the quality of the data is seen as being different from the quality of the survey.
It is also acknowledged that bathymetric data has a very prominent role in hydrography and needs a description that is different from all other kinds of hydrographic data. The description of bathymetric data uses the concepts and words of the S-44 standard, making a direct mapping of S-44 metadata into an S-101 meta-feature possible.
How Will This Work in an ECDIS?
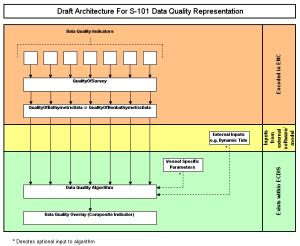 Figure 3 shows how data quality may be represented in an ECDIS. The individual meta-features and attributes that are encoded in the ENC provide inputs into the data quality algorithm, which resides within the ECDIS system. This algorithm will produce the composite indicator. The algorithm also has the capability to accept additional optional inputs from vessel-specific parameters (entered into the ECDIS) and external information (e.g. tides). It then drives an on-demand data quality overlay that exists within the ECDIS system.
The idea of one quality indicator that includes everything between the ship’s keel and the bottom corresponds to the outcome of the mariner’s questionnaire. We believe this will become reality for certain regions where water level prediction systems will become sufficiently advanced to provide the algorithm with information about quality of the prediction. We also believe that ship systems and mariners will be functioning at a sufficient level to provide reliable vessel specific parameters, i.e. parameters that are time and location dependent. However, we are uncertain about the period of time that this will take before these optional parameters will become available. It is our goal to provide an algorithm that is sufficiently flexible to function with and without the optional parameters, to serve the mariner better in trying to plan and execute his voyage safely.
Acknowledgment
This article is partially based upon several documents of the IHO DQWG, and as such represents ideas from all group members.
Further Reading
Sam Harper, Conveying data quality in ENCs to the Mariner -- Work past, present and future of the IHO Data Quality Working Group. In: Proceedings of Hydro2010, 2 to 5 November 2010 in Rostock-Warnemünde, Germany.
Rodolphe Devillers, Marc Gervais, Yvan Bédard, and Robert Jeansoulin, Spatial data quality: from metadata to quality indicators and contextual end-user manual. In: Proceedings of the OEEPE/ISPRS Joint Workshop on Spatial Data Quality Management, 21 to 22 March 2002, Istanbul, Turkey.
International Hydrographic Organization: IHO Standards for Hydrographic Surveys, Publication S-44, 5th edition, February 2008. Published by the International Hydrographic Bureau, Monaco.
International Hydrographic Organization: IHO Transfer Standard for Digital Hydrographic Data, Publication S-57, 3rd edition, November 2000. Published by the International Hydrographic Bureau, Monaco.

Value staying current with hydrography?
Stay on the map with our expertly curated newsletters.
We provide educational insights, industry updates, and inspiring stories from the world of hydrography to help you learn, grow, and navigate your field with confidence. Don't miss out - subscribe today and ensure you're always informed, educated, and inspired by the latest in hydrographic technology and research.
Choose your newsletter(s)


