Morphology and Geohazard Surveys
To identify geohazards and constraints for seabed infrastructure, the data from various types of survey of the seabed and sub-seabed such as bathymetry, seabed morphology, geology, geotechnical and environmental can be combined. This article describes the practice of a multi-disciplined and integrated approach to site investigations and the presentation of survey results as used by Gardline Marine Science. The combined data sets are key inputs to the design and installation of seabed structures from landfall to full ocean depth.<P>
Over the years, the Company has been providing integrated drilling hazards assessment using both 2D and client-supplied 3D seismic data sets. Experts display and interpret these data sets using the Kingdom software suite from Seismic Micro-Technology, Inc. The main object of these surveys is to identify any hazards or constraints in the top-hole section of a well, and to identify potential areas of shallow gas and any other geological limitations to drilling such as faulting or channelling. This seismic information is used to define potential problem areas by conducting shallow gas hazard analysis, multiple attribute analysis and shallow water flow studies. High-resolution multi-channel seismic data are collected using dedicated vessels and can be processed offshore using Landmark's ProMAX system or in the office using WesternGeco's OMEGA system.
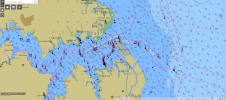
Identifying geohazards within a survey area is the primary focus, and swathe bathymetry data presented in the form of an illuminated sea floor terrain image can greatly aid our understanding of what is going on at and below the seabed.
When any structure is placed on the seabed, a geohazard assessment has to take place; this will aid not only the engineering design but also the installation and infrastructure planning.
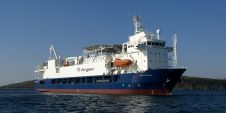
Vessels are equipped with an extensive range of survey equipment to aid the imaging of the seabed and what is below. Seabed morphology mapping uses swathe bathymetry, for example from Kongsberg Simrad, with data processed and displayed in the field by Caris, Neptune and Cfloor software. These swathe data are important for identifying features on the seabed that may be of concern, such as sand waves, pockmarks, signs of mass movement and large obstructions. This mapping is complemented with data gathered using other instruments. Side-scan sonar generally offers a more resolute sea floor image and is used to identify smaller items of debris or obstructions that may impact directly on infrastructure. An example of this would be the need to identify the location of boulders on the seabed and avoid these for the purpose of pipeline installation. The sonar display, interpretation and image processing use a number of CODA software packages. Powerful hull-mounted pingers, surface/sub-tow boomers, sparkers and mini airguns are used to provide extremely high-resolution sub-seabed profiling data. Soil characteristics can be determined using coring and Cone Penetrometer Testing (CPT) equipment deployed from vessels. The sampling programme can be designed in the field to 'ground truth' the interpreted acoustic data, and assist in establishing a more accurate geomorphology and soils model. This information is used to establish design and engineering parameters for projects such as pipeline or cable installation, along with burial, foundation design or anchoring conditions.
Recent legislation has led to increased interest in the provision of information for Environmental Impact Assessments (EIAs). Environmental data gathering can be integrated with the topographic and geological objectives to offer advice on habitats and biota to meet the requirements of an EIA.
To support this expanding sector of the market, a presentation was made at the 6th international conference of Offshore Site Investigation and Geotechnics (OSIG), arranged by the Society of Underwater Technology (SUT) in September 2007. The focus of the presentation was on the requirement to accurately identify and map marine habitats within the subtle textural boundaries in the southern North Sea. It was a major project to lay the Balgzand-Bacton Pipeline (BBL) connecting the UK with The Netherlands. A survey was done to identify areas of sand waves and other obstructions to emplacement with a particular emphasis on accurately mapping the distribution of Sabellaria reefs. The Ross Worm (Sabellaria spinulosa ) is not rare in itself; however, when found in sufficiently high densities, they form a biogenic reef that attracts other fauna to the vicinity. Such reefs are now protected as an Annex 1 habitat under the European Union Habitats Directive.
The survey corridor was deliberately expanded beyond the normal 500m to allow route planning around the reefs. In some cases, the route had to be modified offshore during the survey to allow for sufficient clearance around these reefs to avoid disturbing them. It was concluded that an integrated approach using side-scan sonar, seabed classification of the swathe data using an Acoustic Ground Discrimination System (AGDS) or Roxanne, and indirect sampling by camera and remotely operated vehicle (ROV) was the best way to accurately map the extent of these features. Geographic Information System (GIS) techniques and 3D visualisations are proving invaluable in presenting these related data sets and enabling their distribution to a wider audience of non-specialists, stakeholders and regulators.
Another item that is recommended on major projects is the requirement to conduct a desk-top study before route selection is even undertaken in order to identify any likely problem areas that may require specialist survey techniques such as high-resolution shallow soils information on deep-water slopes, or to identify known archaeological or protected habitats that should be avoided. This will help in providing a cost-effective survey, by identifying potential problems at an early stage.
During a survey, the data collected can be quickly and effectively interpreted offshore to allow for immediate development or change to the scope of the survey work if something unexpected is encountered such as an unknown wreck or a shallow gas hazard is observed below a proposed well location. However, the final charting and reporting is usually carried out back in the office by a dedicated team of geophysicists, surveyors and support services with all charts and figures drafted to a professional standard.
The data that are collected and reported on can also be further enhanced to a highly specialised level, such as design of flowline anchor piles, burial assessments for cables/pipelines and risk assessments for optimisation of cable protection.
Gardline is keen to develop its links with academia and there has been a recent drive to enhance contact with universities. This has been done by offering to provide useful and interesting data sets to people who have the time to really think and study the data, free of the strict deadlines imposed in the commercial world. As part of this, the Company takes on a number of year-out students, which ensures that we are able to recruit capable and knowledgeable staff whilst maintaining contacts with the research staff who are at the forefront of development and thinking within marine geosciences. As part of this programme, the Company is developing a shallow soils interpretation package with a Masters student at the University of East Anglia who is completing part of the package design and testing for a final dissertation.

Value staying current with hydrography?
Stay on the map with our expertly curated newsletters.
We provide educational insights, industry updates, and inspiring stories from the world of hydrography to help you learn, grow, and navigate your field with confidence. Don't miss out - subscribe today and ensure you're always informed, educated, and inspired by the latest in hydrographic technology and research.
Choose your newsletter(s)

