An automated data processing approach to boulder detection
Making manual boulder detection a thing of the past
Rapid technological advancements in AI, machine learning and automation urge the offshore industry to keep up to date with innovations and use them to make data acquisition and data processing more effective. Ever-growing datasets and ever-tightening deadlines make each time-saving solution worth its weight in gold. With this in mind, this article presents an effort to join the quest for data processing acceleration, with a solution for automated boulder detection on multibeam echosounder and sidescan sonar data.
Artificial intelligence, machine learning and automation have become major areas of research and development in almost every field or industry, and the hydrographic industry is no exception. Looking at the results of Hydro International’s most recent yearly survey: 15% of the participants consider machine learning and AI as the most influential driver of innovation in hydrography in the near future, 33% are reading up on it and 24% are developing solutions. Such results clearly demonstrate that the industry is starting to realize the importance of such advances.
Together with the advances in technology, an upturn in renewable energy sources and blue economy investments are causing increased industry demands. Although a cause for optimism, this tendency has a flip side. Scopes and dataset sizes increase in parallel with industry demands, but project time frames do not follow the same trend. Thus, time – along with the associated cost – becomes an ever more essential resource for the hydrographic industry. Consequently, R&D solutions for the automation of laborious manual processes are crucial to the industry’s progress in terms of data processing and management. The need for automation to enhance efficiency becomes evident, for example, in situations where ten data processors spend months manually detecting boulders on sidescan sonar or multibeam echosounder data or invest many hours in manually adjusting geological profiles.
At Hidrocibalae, a marine geophysical data centre, there is a strong focus on strategic development in automated processing and smart data management solutions. This encompasses various tasks, from processing large datasets to handling exports, events and listings. It is crucial to maintain this approach and way of thinking to ensure continuous progress and efficiency in managing and processing data.
Automated data processing
Data processing software plays a significant role in achieving a high-quality and efficient approach to data processing, aiming to maximize effectiveness. Examples of such automatable processes are sediment classification, detection of boulders’ three dimensions and pipeline eventing which, the possibility of their automation notwithstanding, remain primarily conducted through manual labour. The key reason is the uncertainty of the data quality obtained by automated processes, which begs the question: in data processing, can automation surpass human intervention in terms of the resulting data quality?
On the one hand, the mathematical approach utilized in the automated methods can be considered more reliable, as it avoids the inconsistencies caused by differing personal interpretations or survey variations. On the other hand, no matter how reliable and efficient any automated tool is, human intervention is a fundamental part of this process; a paradigm which seems to be here to stay, despite advancements in automation.
The human part of automation
The human role in automated data processing is that of quality control and assurance. Of course, such a role, although significantly less time-consuming, requires the operators to be trained and empowered to perform structural and quality analysis of the automated solutions, becoming IT and data specialists, not just geophysical specialists.
Boulder fields
One marine geophysical data processing activity that lends itself to automation is sidescan sonar object detection, a process that is especially slow and cumbersome in boulder field areas.
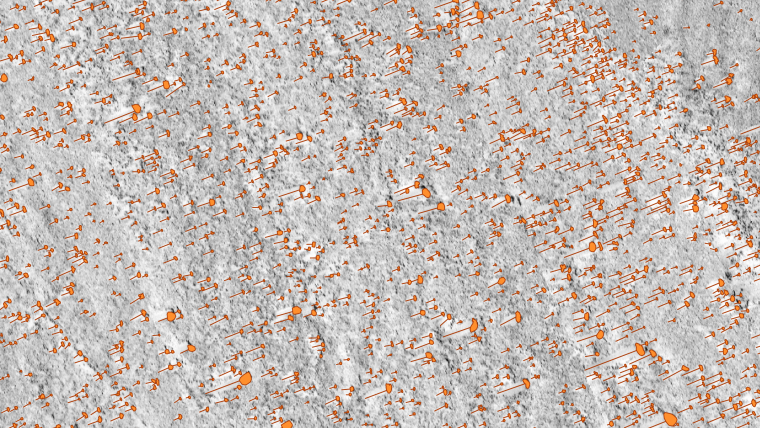
Boulder fields are a seabed morphological type that consist, as the name suggests, of boulders – rock objects whose size varies from a few tens of centimetres up to several metres. They are found in intertidal and shallow-water areas throughout the world, with their formation tied to a multitude of geological, geomorphological and marine processes. However, the focus of the offshore industry lies primarily on boulder fields of glacial origin, found in high-latitude coastal seas of the northern and southern hemispheres. Boulder fields of such origin primarily consist of eroded glacial till surfaces and morainic material left by glaciers receding during the last glacial period and further eroded by subsequent abrasion.
Automation of boulder detection
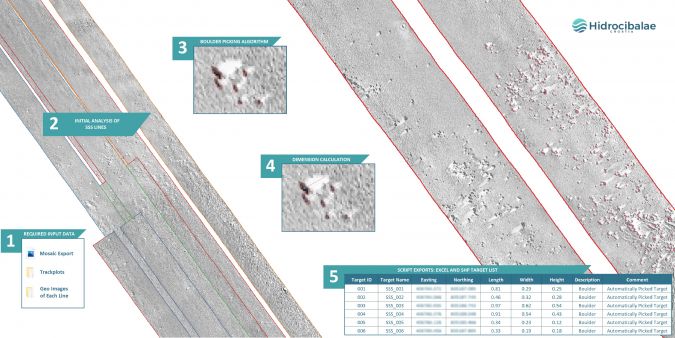
Hidrocibalae’s automated boulder detection tool employs a specifically developed algorithm to effectively analyse large amounts of data and quickly and accurately detect and isolate the crucial components of reflections and shadows, which are fundamental for the representation, identification and measurement of boulders in sidescan sonar (SSS) data. The greatest challenge in developing the automated boulder detection tool was enabling the measurement of boulder heights. While the detection and measurement of length and width can be achieved using the SSS mosaic alone, determining the third dimension (height) requires knowledge of the boulder’s distance from the sensor and the sensor’s height above the seabed at the time of data acquisition. To obtain this essential data, the detection process needs to be performed on each individual SSS line, which introduces the need for automated boulder correlation across multiple SSS lines and the potential risk of double detection.
The estimation of the time required for automated boulder detection is based on three main criteria: boulder density, seabed morphology and sedimentation, and total area. The first criterion, boulder density, is classified in three categories: low-density boulder field (100–1,000 boulders per 0.01km²), medium-density boulder field (1,000–3,000 boulders per 0.01km²) and high-density boulder field (>3,000 boulders per 0.01km²).
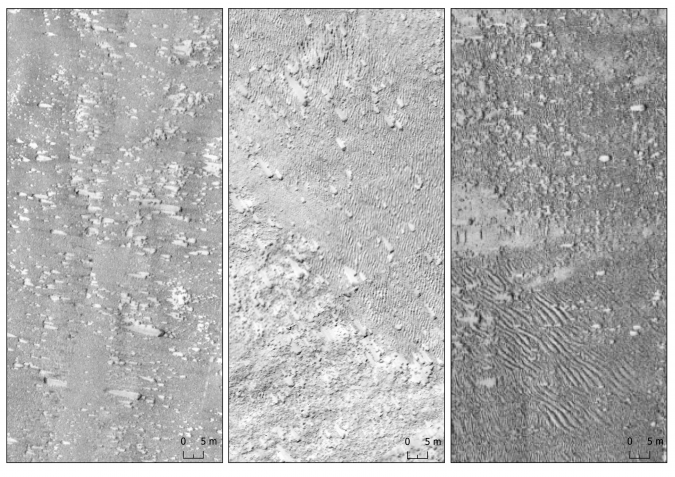
Seabed forms and sedimentation specifics highly affect the time needed to complete the automation process, where silt and sand flat seabed areas are less time-consuming than heterogeneous seabed areas (e.g. sand ripples area with gravelly sand sediment).
When applying the automated boulder detection solution to the survey dataset, the required time for manual quality control is directly proportional to the total size of the survey area.
Human intervention comes into play right at the start of the boulder detection process. Influenced by numerous factors such as variations in seafloor morphology, sediment types, data quality and detection requirements, the SSS data used for automated boulder detection is not consistent in appearance. Thus, applying a single set of detection parameters that would yield consistent precision and accuracy across different instances is not viable. The solution lies in fine-tuning the detection parameters – illustrated in Figure 3 – done by experts with insight into the data, with the goal of achieving optimal performance based on the specific characteristics of each dataset. This high adaptability of the solution capabilities ensures significant versatility across diverse datasets and sources.
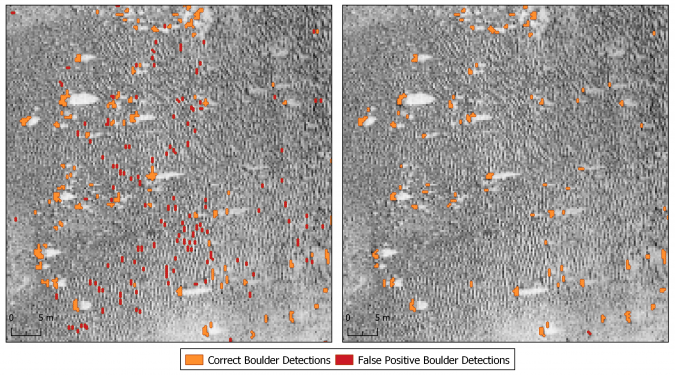
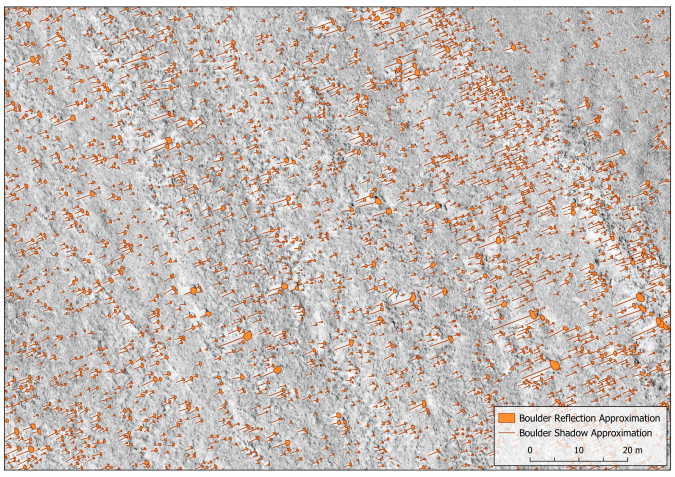
The accuracy of this tool’s detection varies between 90% and 95%, depending on the morphology of the seabed and the data quality. However, since even higher boulder detection accuracy is requisite for most projects, the results of the automated detection are designed with another processing phase in mind – the QC phase. Given that for each boulder, the automated detection yields a polygon that outlines the reflection and a line that outlines the shadow, in the QC phase the processor checks whether the detection results correspond to the real boulder by size and location, making adjustments if necessary. If available, multibeam echosounder data is used as a reference for positioning reliability verification.
Manual quality control therefore enables the processor to ensure accurate and reliable detection results, adjust the results where needed, and improve the overall quality of the detection process. This is different from detection systems whose direct output is a point shapefile with the location of the boulder and dimensions in an attribute table, or a square that outlines the extent of the boulder, where we have no control over what the system precisely measures and recognizes as a boulder.
When requested to identify the same boulder from several SSS lines, a specifically developed tool compares boulder position and dimension on different lines and creates average values for one representative boulder. This task is especially challenging inside high-density boulder fields where boulder reflection varies between the lines.
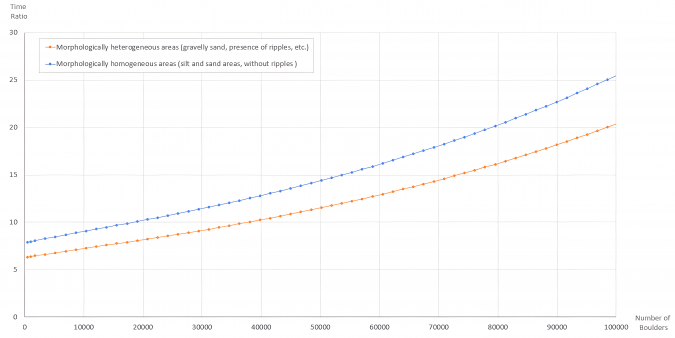
The automated boulder detection solution has been implemented on several projects worldwide, and through monitoring the process, the ratio of time required for automatic and manual detection based on the number of boulders has been estimated, as shown in Figure 5. It is evident that the effectiveness of this solution grows exponentially with an increase in the number of boulders. By implementing this solution, valuable time and resources could be saved in the process of detecting boulders on the seabed.
Conclusions
The prospective of making data processing activities more efficient is real. Although automated processing solutions enable faster obtainment of results, recognizing the role of human intervention is crucial, especially in quality control and assurance. This applies particularly to the boulder detection process, which is often a time-consuming manual process that requires automation intervention to save resources.
The presented solution is continuously undergoing adjustments and improvements, and this is expected to continue in the foreseeable future. The reasons for these ongoing changes lie in the differences in seabed morphology and data quality across various datasets. What remains unchanged is the demonstrated superiority of this solution in terms of efficiency compared with any manual process or approach. Looking ahead, we anticipate that automated boulder detection tools will become the industry standard in the coming years.
The level of automation will be upgraded in subsequent iterations of the analysis of this workflow. The potential to improve data processing efficiency through automation is significant, and the industry should continue to embrace technological advancements to stay at the forefront of innovation.

Value staying current with hydrography?
Stay on the map with our expertly curated newsletters.
We provide educational insights, industry updates, and inspiring stories from the world of hydrography to help you learn, grow, and navigate your field with confidence. Don't miss out - subscribe today and ensure you're always informed, educated, and inspired by the latest in hydrographic technology and research.
Choose your newsletter(s)


