Multispectral multibeam echosounder backscatter data
Multispectral backscatter data to improve seafloor characterization
The multibeam echosounder (MBES) is used for various purposes, and MBES systems have become the standard instrument for bathymetric determination. However, new developments mean that MBES systems are no longer limited to depth readings alone. One innovation is the possibility to record the backscatter data of the acoustic beams. MBES backscatter recordings can be used for seafloor classification and object detection. Backscatter options in MBES have grown from monospectral using a single frequency to multispectral MBES backscatter data, but what are the benefits? This article describes the results obtained during a Bachelor’s research project at the Maritime Institute Willem Barentsz in partnership with Deep BV Hydrography & Geophysics, both in the Netherlands.
MBES backscatter imaging
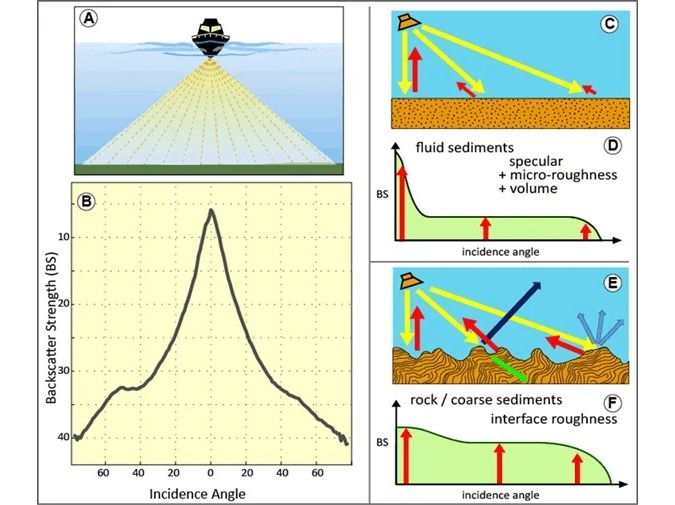
Backscatter data provides information about the composition of the seafloor. This data can be used to investigate properties of the seafloor, such as hardness, sediment characteristics and even sediment grain size. MBES bathymetry and backscatter data are collected at the same time. The delay between emission of the pulse and receipt of the returned signal provides a depth measurement (bathymetry), while the strength of the returned signal indicates the reflectivity of the seafloor (backscatter). Multispectral MBES imaging uses two or more frequencies from the same MBES. To do this, the MBES uses a different frequency per consecutive ping. This ability to collect data with multiple frequencies in one pass may allow better distinction between sediment types.
At the same water depth and under the same conditions, higher frequencies and thus shorter wavelengths result in a higher resolution. A higher resolution means that more details can be seen and thus a distinction can be made between small particles, including sediment particles. A longer wavelength (low frequency) has a lower resolution and will, theoretically, distinguish only coarse sediment. High frequencies, on the other hand, are better able to distinguish fine and coarse sediment simultaneously.
Multispectral operation
While collecting multispectral data, the frequency changes per ping, and the user can select which frequencies to use in advance. In one single pass over an area, the MBES can therefore record bathymetry and backscatter data using two to five different frequencies. Requirements depend on the project specifications or seabed conditions. If it is known in advance how each frequency responds to a sediment type, this knowledge can be used during specification.
Practical research
The aim of the research was to find out whether the use of multispectral MBES has a definitive advantage over the use of monospectral MBES for soft sediments. Sand, mud, silt, peat and ‘flora and fauna’ type bottoms within easy reach of Amsterdam, the Netherlands, were researched.
To verify whether multispectral data improves seafloor characterization, several methods were used to collect the data. To check whether the correct seafloor was identified and to analyse differences, ground truthing measurements were executed using a Van Veen grab sampler. Various checks were carried out to determine the soil type, for example of the grain density, moisture and stickiness of the sediment. The research was conducted in the Vinkeveense Plassen, the IJ (Amsterdam) and IJmuiden.
Backscatter data was acquired using both MBES and side-scan sonar (SSS) using the following settings:
MBES (R2Sonic 2024):
- Monospectral MBES setting: 400kHz
- Multispectral MBES settings: 200kHz, 400kHz, 700kHz
SSS (Edgetech 4125):
- SSS: 455kHz
Once the multispectral backscatter data had been collected, it had to be separated into different frequencies before it could be used. Software packages such as QPS FMGT can be used to divide the multispectral data into a series of monospectral datasets. Processing and data analysis were executed in QPS Qimera, QPS Fledermaus Geocoder Toolbox (FMGT) and SonarWiz, and FMGT Angle Range Analysis (ARA) was performed based on the Jackson model for automatic bottom classification. ARA can be used to determine a sediment characterization based on information such as frequency and grain size using a standardized backscatter response curve.
Backscatter results
An early result was that data density is something to consider when performing multispectral backscatter analysis. As shown in Figure 2, the data in the curve is different from the data recorded in one straight line. Due to the sharp turn of the ship, there is a poorer positioning of the MBES system. In addition, the data density is lower at the outer bend and higher at the inner bend, compared to the mean data density. This is because the same number of beams must be distributed over a larger surface (outer bend) or a smaller surface (inner bend). Furthermore, data is more ‘stretched’ in multispectral datasets due to the lower data density per cell, while data in monospectral datasets has a higher data density (and thus a higher hit count). The lower along-track resolution stems from the ping rate having to be shared by the different frequencies. In other words, at three different frequencies, the ping rate will be at least three times lower than for monospectral MBES.
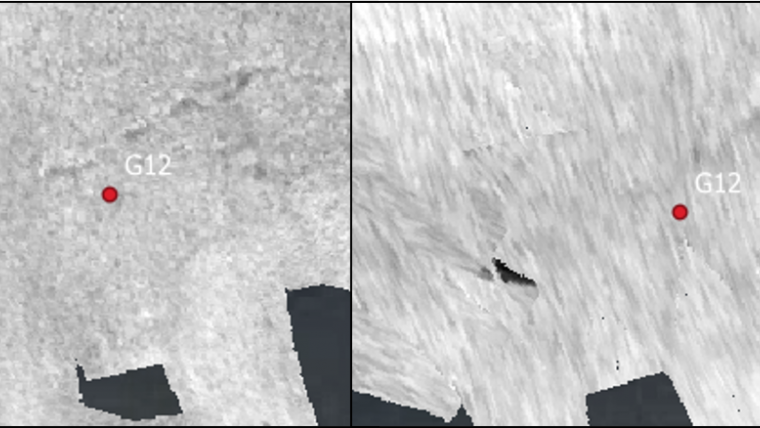
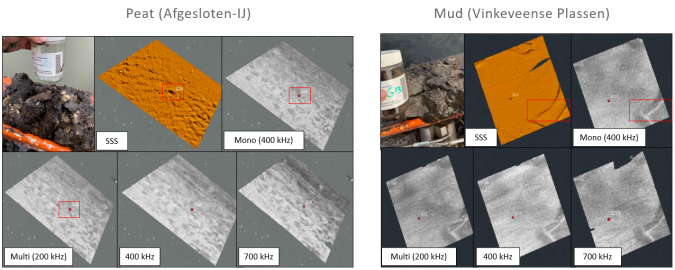
As expected, the higher the density of the material, such as bivalves or sand, the harder the reflection. With lower density materials, such as mud and silt, the returned signal is much weaker because it partly remains in the soft (smaller grain-sized) material. However, the 700kHz setting quickly produced an oversaturated image that needed to be compensated for, because this signal was scattered in the water column. This created an unreliable picture for every sediment type.
The use of multiple frequencies did not show different sediment layers; hence, it did not seem to add anything when compared to the higher resolution, monospectral mosaics. One disadvantage is that there is currently no method available to display or process multispectral data as actual multispectral data. No further analysis was done on integrating the three derived monospectral sets (from the original multispectral) into a conclusive multispectral image. By examining small variations at the same locations, it may be possible to derive more information. However, current software support for such a method has not been found.
ARA results
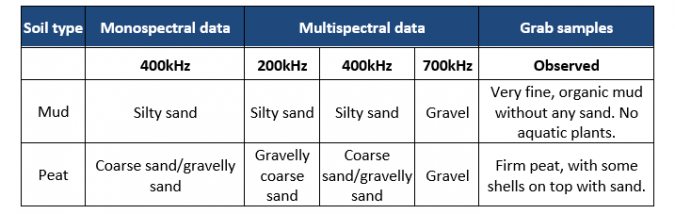
As stated, the various (derived) monospectral backscatter sets were processed using FMGT with the ARA tool. During the fieldwork, different backscatter areas were measured where there was a variation in either depth or salinity. When the grab samples and backscatter ARA results were compared, the backscatter data could not confirm the same material, as can be done with ground truthing. This was however true for all backscatter sets and not just for the multispectral data. Overall, all frequencies were observed to be in error.
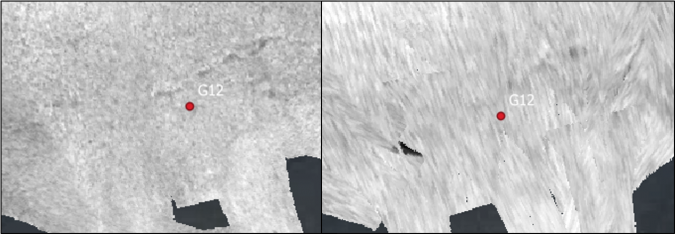
For all locations, the ARA classification is incorrect and/or gives similar results across all frequencies, while the sediments differ strongly within the area, as is partially shown in the figures. Therefore, the ARA analysis is considered not fit for purpose for these types of smaller areas but could work for bigger areas where ARA is calibrated with grab samples and the bottom remains constant.
Conclusions
The original hypothesis that multispectral backscatter data will provide better possibilities when it comes to the automated classification of soft sediments is contradicted by this research. While the largest differences in backscatter values were expected between the coarsest and the finest bottom sediments, the research reveals that differences can be observed between strongly deviating sediments, but only visually. The SSS and backscatter (monospectral) and multispectral show almost identical mosaics. Software to analyse multispectral data could have benefited this research, but is currently lacking.
Comparing the advantages and disadvantages, it can be concluded that multispectral MBES backscatter data currently does not improve seafloor characterization, looking at the monospectral datasets and soft sediment types. Furthermore, 700kHz is not suitable due to excessive saturation of the image. Due to data quality issues, it is better to sail in monospectral mode or use an SSS than to use multispectral mode.
Acknowledgements
Thanks are due to S. Bruinsma and S. Pitka.

Value staying current with hydrography?
Stay on the map with our expertly curated newsletters.
We provide educational insights, industry updates, and inspiring stories from the world of hydrography to help you learn, grow, and navigate your field with confidence. Don't miss out - subscribe today and ensure you're always informed, educated, and inspired by the latest in hydrographic technology and research.
Choose your newsletter(s)


