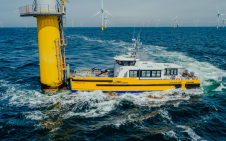
Triaxys Wave Buoy and RD Instruments ADCP
Comparison of Directional Wave Parameters
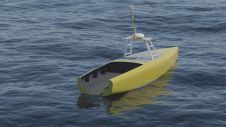
Since July 2004 the author has been routinely measuring waves 10km offshore Savannah, Georgia, at a site with mean water depth of 13m, using a Triaxys wave buoy (see wavebuoy.gtsav.gatech.edu). This report summarises a comparison of directional wave parameters from the buoy and 1,200kHz RD Instruments Acoustic Doppler Current Profiler (ADCP) equipped with pressure transducer and waves firmware.
The ADCP was deployed beside the wave buoy, resulting in 72 days of comparative simultaneous hourly measurements of directional wave-energy spectra from the two systems. The goal of this report is to provide some results for objective comparison of the two instrument systems. No instrument exists which can reliably report the true wave-energy spectrum: all report an estimate. So the goal here is to compare these estimates with emphasis on scalar parameters derived from the directional spectra.
Deployment Site
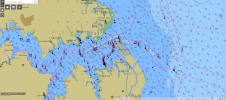
Figure 1 shows the deployment site 10km offshore Tybee Island, Georgia. Mean water depth here is 13m and mean tidal range 2.1m. The site features diurnal tides and the mean flow magnitude, depth-averaged, for the period under consideration was 20cm/s. Instruments were programmed to collect twenty minutes of wave-burst data every hour. The ADCP samples velocities at 2Hz, and the buoy samples multiple parameters at 4Hz for determination of wave-energy spectra. The buoy was configured with an iridium satellite modem (as the first to be so equipped) which provided hourly updates of directional wave spectra and other parameters. Details regarding the deployment may be found in Table 1.
Measure and Analysis
The two measurement approaches differ greatly. The ADCP range gates the acoustic signal returned from particles in the water along four narrow acoustic beams. It saves data defining along-beam velocity in the three top bins nearest the water surface for post-processing to determine wave parameters. This approach yields twelve different time-series for processing, four velocities in each of three layers, to determine directional wave characteristics: Terray et al (1997), Rørbæk et al (2000).
The buoy records six time-series, defining motion plus heading. The time-series come from three accelerometers plus three rate gyros. These signals are processed to determine heave, east and north velocities, from which directional wave-energy spectra are computed. The buoy is assumed to follow the water surface and thus mimic wave-induced water motion at the surface.
Data processing for each instrument was done using manufacturer-provided, proprietary software. The buoy actually processes the data onboard and transmits the resulting Fourier coefficients, although it also stores both this information and raw data onboard. The WavesMon software provided by RD Instruments was used to process the ADCP data after recovery. The buoy reports energy up to 0.64Hz, but a common cut-off frequency of 0.35Hz was used for all comparisons shown here. Other than sampling schedule, there are few user-specified options for the collection or processing of the wave-buoy data. Parameters for processing of the ADCP data are detailed in the report by Work and Bystrom (2005).
Results and Report
The wave-buoy estimates wave parameters based on both time-domain and frequency-domain analysis. Only the latter will be considered here since time-domain analysis, i.e. zero-crossing analysis, is not an option with the ADCP. The data analysis techniques are not exactly the same for the buoy and ADCP but both systems yield directional energy spectra for comparison. In both cases wave parameters were computed from the directional spectra output by the appropriate proprietary software. The parameters to be compared are defined in the printed version of the magazine.
Figure 2 shows wave heights for the first five weeks of the measurement period. Figure 3 compares mean wave periods. Differences between measurements are summarised in Table 2. Figures 4 and 5 compare peak and mean wave directions. Peak directions exhibit more scatter; the mean of the magnitude of the difference in mean direction is seven degrees. Table 2 summarises the statistics of the basic wave parameters for the entire measurement period. The second column lists the mean value for a particular parameter as measured by the buoy minus the value recorded by the ADCP (preserving the sign), revealing any systematic differences in measurements. The third and fourth columns contain the mean value and standard deviation of the difference in magnitude between parameters measured respectively by the two systems.
A brief discussion of the one and two-dimensional energy spectra reported by the two measurement systems is included in the report by Work and Bystrom (2005). A more detailed look at the directional spectra, including investigation of higher order moments, is planned. For the site considered here a wave buoy has proven to be a good choice since real-time measurements were desired and the wave buoy, equipped with an iridium satellite modem, served essentially as a turnkey system with no requirement for cabling or nearby shore-station for power or telemetry. It appears to yield wave properties that closely match those reported by a bottom-mounted ADCP and we have been able to deploy it for up to seven months at a time without re-powering or downloading.
References
- Rørbæk, K. and H. Andersen (2000). Evaluation of Wave Measurements with an Acoustic Doppler Current Profiler. IEEE International Symposium.
- Terray, E., R.L. Gordon, and B. Brumley, 1997. Measuring wave height and direction using upward-looking ADCPs. Proceedings of Oceans '97, Halifax, Nova Scotia, Canada, MTS/IEEE, v. 1, 287-290.
- Work, P.A., and Bystrom, E. (2005). Triaxys wave buoy and RD Instruments 1,200kHz ADCP: Comparison of primary directional wave parameters, Tybee Roads, GA. Georgia Tech-Savannah Civil and Environmental Engineering Research Report, (October 2005). Available at wavebuoy.gtsav.gatech.edu.

Value staying current with hydrography?
Stay on the map with our expertly curated newsletters.
We provide educational insights, industry updates, and inspiring stories from the world of hydrography to help you learn, grow, and navigate your field with confidence. Don't miss out - subscribe today and ensure you're always informed, educated, and inspired by the latest in hydrographic technology and research.
Choose your newsletter(s)

