ALB Evaluation for NOAA Charting Requirements
Creating Acceptance Test for Airborne Lidar Bathymetry Data Application to NOAA Charts in Shallow Waters
The National Oceanic and Atmospheric Administration (NOAA) acquires hydrographic data around the coasts of the US and its territories using in-house surveys and contracting resources. Hydrographic data are primarily collected using sonar systems, while a small percent is acquired via Airborne Lidar Bathymetry (ALB) for nearshore areas. NOAA has an ongoing requirement, as per the Coast and Geodetic Survey Act of 1947, to survey nearshore areas as part of its coastal mapping activities, including updating nautical charts, creating hydrodynamic models and supporting coastal planning and habitat mapping. NOAA has initiated a project to investigate the potential use of ALB data from non-hydrographic survey programmes (i.e., programmes designed to support objectives other than nautical charting and with specifications and requirements that differ from those of NOAA hydrographic surveys) in order to increase the amount of data available to meet these nearshore mapping requirements.
This paper presents an evaluation of ALB data from the US Army Corps of Engineers (USACE) National Coastal Mapping Program (NCMP) for use by NOAA’s Office of Coast Survey (OCS). These NCMP datasets were evaluated through a statistical comparison to bathymetric surfaces derived from hydrographic NOAA surveys. The objectives of the analysis were: 1) to assess the level of agreement between the NCMP and OCS data in areas of overlap in a variety of coastal environments, and 2) to determine whether NCMP ALB survey data can be compiled with NOAA OCS hydrographic data to generate seamless shallow-bathymetry digital elevation modes (DEMs).
Data Comparison and Analysis
During the course of this study, bathymetry from ALB was assessed as potential resource to fill in the data gaps shoreward of the navigable area limit line (NALL) (0 to 4m). This is important because NOAA hydrographic sonar systems, for safety and economical reasons, are not typically used in this range. The study also investigated, though to a lesser extent, the potential use of applying ALB data to nearshore areas ranging from 4 to 10m and areas deeper than 10m based on the ALB survey and the coastal conditions. In doing so, it was necessary to understand the survey standards of the USACE NCMP and the other outside ALB survey programmes. The resulting bathymetric products were compared to survey standards of NOAA and other hydrographic offices (e.g., S-44 of the International Hydrographic Office (IHO (IHO), 2008)) and this study allowed us to develop a procedure to gather ALB survey data from federal archives (NOAA and USACE), process the laser measurements into bathymetric surfaces and conduct statistical analysis.
The statistical analysis in this project consisted of several steps:
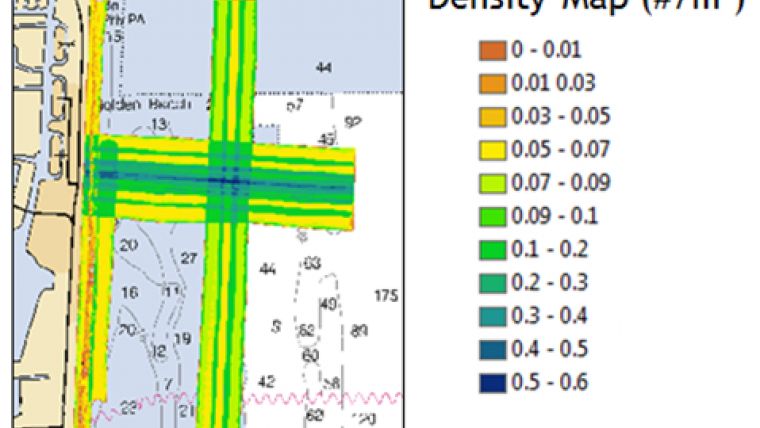
- Determining the bathymetric ALB density (i.e., the number of laser measurements per unit area),
- Calculating the mean and standard deviation of the depth differences between the NCMP ALB and the OCS hydrographic datasets,
- Plotting a histogram for each study site to gain an understanding of the distribution of depth differences over the entire ALB dataset and,
- Creating a scatter plot for each study site to show the difference between the two datasets as a function of depth.
Four study areas were selected based on the extent of overlap between the USACE NCMP and NOAA OCS hydrographic datasets and the goal of conducting the comparisons in different geographic regions with differing seafloor compositions (Figure 1, Table 1): Kittery, ME (sand, gravel and rocky outcrops), Pensacola, FL (sand), Port Everglades (coral, sand and hard bottom) and Ft. Lauderdale (coral, sand and hard bottom). The USACE NCMP data were collected using Optech SHOALS-1000 and SHOALS-3000 (sampling rate of 1kHz and 3kHz, respectively) and Airborne Hydrography AB HawkEye II (sampling rate of 1kHz) systems.
| Study Area | Seafloor Type/Characteristics | NCMP | OCS | ||
| Spacing | Year | Spacing | Year | ||
| Fort Lauderdale, FL | Sandy and Hard Bottom Coral | 4x4 | 2012 | 4x4 | 2009 |
| Port Everglades, FL | Sandy and Hard Bottom Coral | 4x4 | 2009 | 0.5x0.5, 1x1 | 2008 |
| Kittery, ME | Fine Sand with Rock Outcrop | 5x5 | 2007 | 0.5x0.5, 1x1 | 2006 |
| Pensacola, FL | Sandy and Hard Bottom Coral | 3x3 | 2010 | 1x1, 2x2 | 2009 |
Table 1: The seafloor characteristics and study sites investigated in the project.
It is important to note that evaluation of object detection was considered to be outside the scope of this study. The analysis was simplified to identify the vertical differences between two datasets and determine if there are any issues in generating a seamless bathymetric surface.
Meeting NOAA Standards
A Point density calculation was performed on each NMCP dataset and a density map (i.e., a raster map showing the number of laser measurements per grid cell) was created. The green and blue lines of the Fort Lauderdale NCMP density map (Figure 1) indicate a greater number of laser measurements. Due to the large number of soundings, and because the focus of the study was to quantify the level of agreement between the NCMP Lidar and the OCS multibeam data, spot spacing and density maps were not calculated/generated for the OCS multibeam data.
A difference map was created for each study area (Figure 2) in order to evaluate spatially the vertical differences between the two datasets and identify any major biases. For purposes of this study, a bias of up to 0.2 metres between the NMCP ALB and the NOAA OCS hydrographic dataset was considered reasonable. As there are several factors that could lead to a vertical offset of this magnitude in comparing one dataset against the other (e.g., seafloor change between survey dates, a slight bias introduced in performing vertical datum transformations, and/or a slight shoal bias introduced by survey procedures). In addition to height differences, the spatial maps identified coverage gaps in the NCMP ALB datasets.
Histograms were then generated for each site to show the frequency of elevation differences between the two datasets. For example, Figure 3a presents the histogram of the difference measurements over Port Everglades, FL. Scatter plots were also created to evaluate the difference measurements as a function of depth (Figure 3b). The scatter plot shows that there is little correlation between depth and depth difference (i.e., difference between the NCMP ALB data and OCS hydrographic data).
Our intention was to conduct an analysis of ALB dataset over different bottom types in different geographic areas. Unfortunately, no muddy seafloor sites were found with overlap between the USACE NCMP and NOAA OCS hydrographic datasets. The four study sites showed a consistency in depth difference between the OCS hydrographic datasets and the NCMP ALB datasets (Table 2).
Results and Conclusions
|
Areas |
Mean differences |
Standard Deviation |
|
Fort Lauderdale, FL |
0.17 m |
0.32 m |
|
Port Everglades, FL |
0.54 m |
0.27 m |
|
Kittery, ME |
0.17 m |
0.39 m |
|
Pensacola, FL |
0.12 m |
0.94 m |
Table 2: Summary statistics from the comparisons in the four areas.
The NCMP ALB datasets investigated were relatively consistent with OCS hydrographic data between the ranges 3 to 10 metres (Figure 4). Of all the sites investigated, the Pensacola site was the only study site that had a very active seafloor (i.e., sandy area near a tidal inlet). Thus, the period between the surveys was an important factor for the comparison. Even after only one year, the standard deviation was close to 1.0m. The reason for this large standard deviation is most likely environmental (turbidity and change of the seafloor). NCMP coverage shows gaps which also may be related to tidal stage (flood versus ebb) or rough sea state conditions.
Our analysis of the four datasets suggests that NCMP ALB can be considered as a means to supplement or update shallow bathymetry on nautical charts under the following conditions: 1) coastal areas up to 10m and 2) where most seafloor types are rocky/sandy/coral areas (excluding muddy areas). In general the majority of the differences are close to or lower (i.e., better) than the stated accuracy of the systems.
Future Directions
The focus of this study was on the ALB systems used in the NCMP until 2012. Since mid-2012, a new ALB system has been introduced (Optech CZMIL). In addition to the USACE NCMP, ALB data from additional systems are available through other national programmes, such as the National Geodetic Survey and the US Geologic Survey. Datasets from these programmes and the various Lidar systems will be investigated in the near future. One additional direction that will be investigated is the temporal component in the compilation of hydrographic data with non-hydrographic ALB surveys. The impact on the seamless bathymetry products will be evaluated as a function of the seafloor characteristics and the period between two surveys.
Acknowledgements
The authors of this publication would like to thank the leadership of NOAA’s Coast Survey, Geodetic Survey, and Joint Hydrographic Center as well as all the employees who contributed to this project including Steve Gill from NOAA’s Center from Operational Oceanographic Products and Services and Jennifer Wozencraft and Chris Macon from USACE’s Joint Airborne Lidar Bathymetry Technical Center of Expertise (JALBTCX).

Value staying current with hydrography?
Stay on the map with our expertly curated newsletters.
We provide educational insights, industry updates, and inspiring stories from the world of hydrography to help you learn, grow, and navigate your field with confidence. Don't miss out - subscribe today and ensure you're always informed, educated, and inspired by the latest in hydrographic technology and research.
Choose your newsletter(s)


