Hydrographic survey of Venice inlet channels
Sharing knowledge to make data available for everyone
What does ‘hydrography’ really mean? IHO defines hydrography as a description of the physical features of the ocean in support of different marine activities. A recent paper shows how hydrographical datasets can provide knowledge that is useful for many different purposes, from marine spatial planning to environmental studies. The paper focuses particularly on the Venice lagoon, where history and modernity, and natural and anthropogenic factors are fused together in a complex system.
In 2015, based on the key strategy of ‘once at sea in support of different activities’, the Italian Hydrographic Institute (IIM) and the Institute of Marine Sciences of the National Research Council (CNR-ISMAR) openly shared their own data of the Venice Lagoon tidal channel network (Figure 1), making it available to the public, the scientific community and stakeholders through the paper titled High resolution multibeam and hydrodynamic datasets of tidal channels and inlets of the Venice Lagoon. Sci. Data 4:170121 doi: 10.1038/sdata.2017.121. (Madricardo et al. 2017).
Materials and methods
In 2016, within the Italian flagship project called RITMARE, a common multibeam echosounder survey was carried out within the Lido Inlet of the Venice Lagoon (Figure 1) by means of a Kongsberg EM2040C single-head dual-swath multibeam echosounder (MBES) connected to a Seatex Seapath 330 attitude and heading reference system and a Fugro 9002 GNSS receiving Fugro HP differential corrections (DGNSS mode).
The key operational rules of procedure were:
- Conduct the survey with water column data (WCD) logging always on. It is a way to look into the future. Hydrographic software is improving and it will soon be possible to extract further information and knowledge from WCD as can already be done for seafloor data.
- Record data with the best resolution, sometimes reducing the speed of the vessel, especially for best backscatter (BS) data acquisition.
- Connect data to a 4D reference frame. A measure is basically a number given by the instrument which must always be connected with a frame.
Primarily, within the International Terrestrial Reference System 89, the frame ITRF2008 was chosen as the horizontal component.
Secondly, the vertical component chosen was the ZMPS (Zero Mareografico Punta della Salute), the zero level connected with the ellipsoidal and geoidal vertical reference frames (including the local mean sea level and the tidal datums). ZMPS was defined as the medium value of level observations at Punta della Salute between 1885 and 1909. Finally, UTC was chosen for the timing.
Results
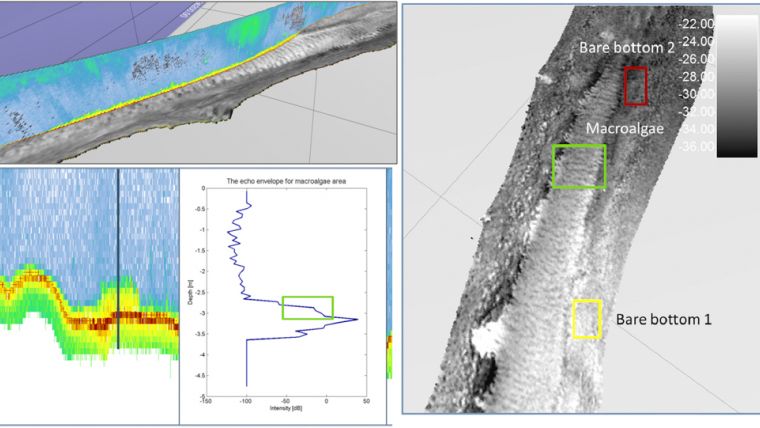
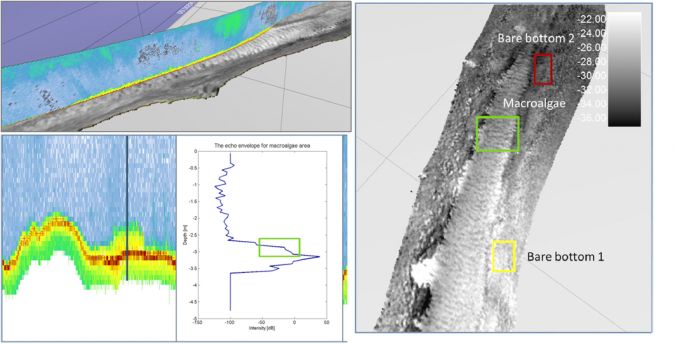
The result of the survey is a complete data package (WCD, BS, bathymetry) that is useful for different applications, such as safety of navigation, research, dredging and other applications in the future. Figure 2 shows an example of WCD mapped over the BS mosaic draped over bathymetry. Notably, the presence of submerged aquatic vegetation could affect the bottom detection, therefore affecting the resulting bathymetry. Beside bathymetry, BS intensity can change over time depending on the submerged aquatic vegetation orientation.
The 2016 MBES survey can be compared to previous surveys conducted in the area, taking into consideration different final uncertainties and resolution of different datasets. On the contrary, comparisons such as the difference between sea bottom grids or backscatter can be done only when the reference frames are fixed and shifts among them are known with a good estimation, at least comparable with the uncertainty of the measures.
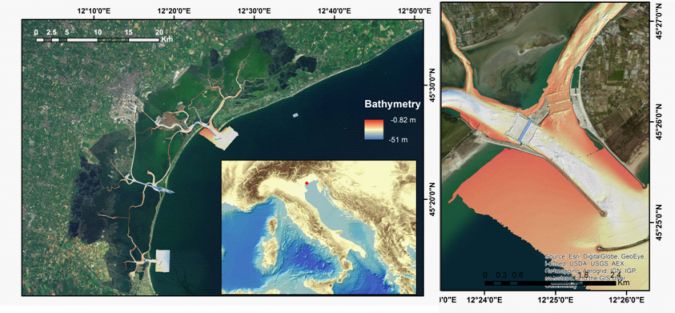
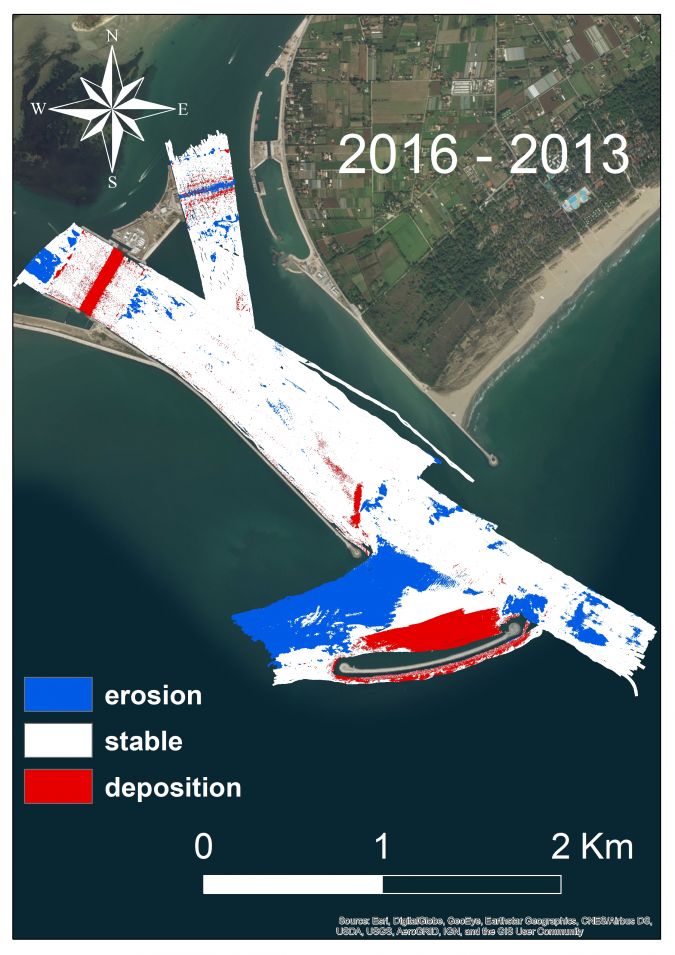
Figure 3 shows the difference between the bathymetric data in 2013 and 2016 of the main lagoon inlet channel showing the area in deposition and erosion, taking into account that the construction of large mobile barrier is ongoing at the inlets. This data has different stakeholders, connected not only with the safety of navigation or dredging, but also with the study of geomorphological evolution of the inlet over time.
On the one hand, the erosion ongoing close to the edge of the breakwater (indicated by the black arrow in Figure 3) just outside the seaward inlet entrance could affect the stability of the structure in the next years. On the other hand, deposition ongoing close to the barriers could possibly interfere with the mobile barrier functioning.
Conclusions
Hydrographic surveys are often very expensive and time-consuming. Therefore, it would be very effective to set up common acquisition protocols in order to collect data useful for different purposes, such as geomorphological studies and benthic habitat mapping.
Bathymetric comparisons can provide precious data not only to the scientific community, but also to stakeholders responsible for coastal management, as it was shown for the Lido Inlet in the Venice Lagoon. The acquisition of WCD is strategic not only for future possible applications, but also because it could be crucial for the right assessment of depth in very shallow waters in the presence of submerged aquatic vegetation. Last but not least, pooling and sharing between hydrographers and scientists can improve data acquisition and processing, leading to benefits for both communities as well as in the general public interest.

Value staying current with hydrography?
Stay on the map with our expertly curated newsletters.
We provide educational insights, industry updates, and inspiring stories from the world of hydrography to help you learn, grow, and navigate your field with confidence. Don't miss out - subscribe today and ensure you're always informed, educated, and inspired by the latest in hydrographic technology and research.
Choose your newsletter(s)


